Design an Amusement Park

“All designs are a compromise on the designer's attempt to combine certain desirable features without sacrificing too much safety, comfort, and cost.” — L. Francis Herreshoff
Design an Amusement Park
Can you design an experience? Absolutely! But engineering helps. There are tools available to help you predict how your intended users will experience your design. With the help of these tools you can optimize your design, bringing all of your goals into balance.
That is what this exercise is about. You will design, analyze, and optimize an amusement park. We can even make it into a game. Then, if you are part of a lecture or workshop, we can give you a tour of some of the mathematics which drive this game.
The Basic Idea

There are nine tiles upon which you can construct your park. The park entrance point is to the south-east.
You may place at most one park attraction on each tile. You have many attractions to choose from and you can add or remove attractions whenever you like.
The arrangement of attractions is important because the park-goers do not like to walk too far.
Drag and Drop

|

|
The unused attractions are shown on the left side of your screen. Use your mouse to drag any attaction you choose and drop it onto one of the vacant tiles in the park.
To remove an attraction from the park, use your mouse to simply drag it off the park. When you release the mouse, the attraction will return to its original unused position on the left.
For Whom Are You Designing?

You have three consumer groups to please with your design. There is an instant score posted for each design you propose.
Each consumer group is equally important so look at the lowest satisfaction rating (27% in the example above) as the consumer rating of your design.
Minimum Requirements

When you are just beginning, there is no satisfaction rating. That is because your park must have a minimal set of attraction types before it is acceptable to park-goers.
So you will see "Need Rides" or "Need Amenities" or "Need Shows" in the Consumer Utility table until you have provided at least one attraction of each type.
Attraction Types and Appeal

When your mouse hovers over any of the attractions, a pop-up description will appear. For the Horror House attraction, you can see that it is a "Ride" and that it appeals mainly to teen parties. (The number of asterisks (*) measures the appeal.) Families and seniors do not care for it.
What's Wrong With This Design?

This design looks good from a consumer rating standpoint (the lowest satisfaction score is 73%) but we have not yet considered walking time in the consumer rating.
Click the switch labelled "Consider walking time" to have the ratings reflect walking time.
A Long Walk

When we consider walking time, we estimate the flows of people who will be walking between pairs of tiles. These are superimposed on the layout as thick lines between pairs of tiles: the thicker the line, the greater the flow. It doesn't display what the direction of flow is.
People expect to walk from one attraction to another so there is no penalty if the attractions are in adjacent tiles. But in this example, the Big Top is two tiles away from the BBQ Pit and there is a heavy flow on that connection. This shows up as diminished satisfaction for the consumers.
A Better Layout

By moving the Big Top closer to the BBQ Pit we are able to restore our consumer satisfaction scores to their previous values.
That is, if all flows are between adjacent tiles, there will be no penalty for walking time.
It Gets Complicated!

As you add attractions, you give your consumers more choices and the flows through the park can get quite complicated.
You should try to reduce the distance between tiles with the heaviest flows (thickest lines).
You will likely discover that a balanced design "looks nice." Trust your eyes!
Go to the Next Level

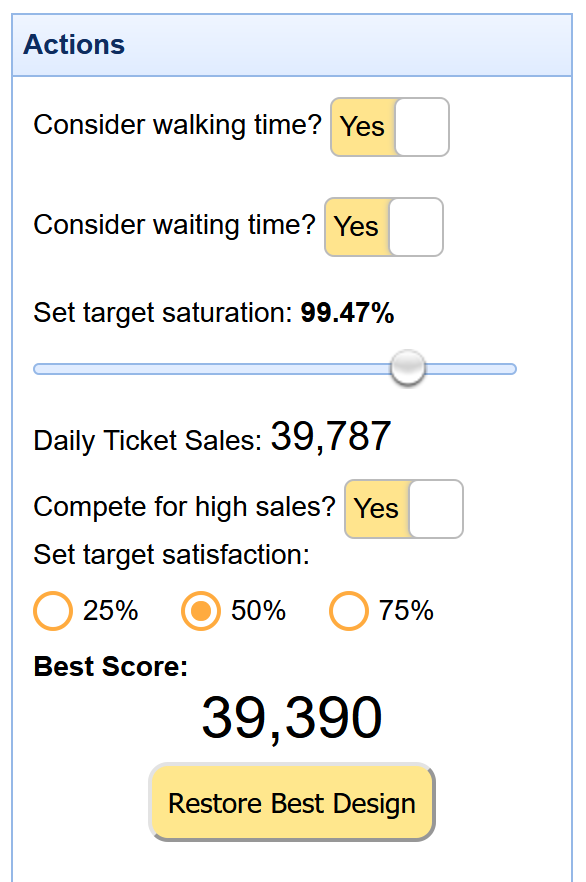
At the next level you will plan your ticket sales: this is how your park will make money.
But with high ticket sales your consumers will experience queues at the attractions. This will diminish their satisfaction. So you must consider waiting times together with ticket sales.
Click the switch labelled "Consider waiting times" to activate this level of analysis.
Waiting Times

With "Consider waiting times" switched on, you will see an estimated waiting time for each attraction (the numbers with blue backgrounds). These are the number of minutes consumers can expect to wait to get access to the attraction.
In this example, waiting times are all a minute or less so this will have little to no impact on consumer satisfaction. But queues can have quite volatile behavior...
Low Saturation

Now you are given a slider bar to control the saturation level of your park. Ticket sales will adjust automatically to come as close to that target saturation as possible.
At a low saturation level like this (target=90.2%), ticket sales are low, but waiting times are also low and consumer satisfaction is high.
Moderate Saturation

By increasing the saturation level to 97.5%, we can increase estimated ticket sales from 36,000 per day up to 39,000 per day.
But, waiting times have also increased to 11 minutes or more and consumer satisfaction has dropped to 48%. There is clearly a tradeoff here.
Maximum Saturation

When we set the target saturation to its maximum value, we see that ticket sales have increased to almost 40,000 per day, but at what cost? Waiting times have exploded (3276 minutes is almost 55 hours)! Consumers would have to really want the experience to wait in queues that long.
Not surprisingly, consumer satisfaction has vanished (0%). We would be unlikely to stay in business with this design.
Design is filled with tradeoffs.
The Satisfaction vs. Saturation Tradeoff

We cannot tell you with this simple model how to weigh consumer satisfaction against ticket sales saturation. That is a difficult business and social decision that should consider more than just these factors.
But, to make this into a game, we could set a minimum consumer satisfaction level. The designer who comes up with a park design and target saturation which meets this minimum and achieves the highest daily ticket sales wins the game. That could be fun.
Make It A Game

Click the switch labelled "Compete for high sales" to activate the game feature.
We offer three different game choices (25%, 50%, and 75%) corresponding to the minimum target satisfaction level across consumer types.
Initially, there is no "best score." You must first find a design and saturation level that achieves the target satisfaction level.
Feel Free to Experiment
As you search the design space, it is easy to forget what was your best solution.
We keep track of your best solution (layout and saturation level). Just click the "Restore Best Design" to get back to it.
Ready to Play
Click the link to open the game in a new browser window.
Design an Amusement ParkAfter the game, come back here to learn more advanced features of the software. If you are part of a lecture or workshop, your instructor may use the experience to cover some of the following topics:
- Consumer Choice Models
- Kingman's Approximation to the GI/G/s Queue
- QNET: A Queueing Network Analyzer
- Equilibria in Nonlinear Systems
Balance
It is likely that your best solution was a balanced design: it has something for everyone and does not go to extremes in saturation.
View Other Scores

Click on the "plus" sign in the upper right corner to view scores for the game. It is visible only if you have a valid best score.
To skip this topic navigate to the right. To step through it in detail, navigate down.
Middle of the Road Solution

Your recent best score is shown as a big red dot. It is visible only if you restored it by clicking the "Restore Best Design" button.
If you click on one of the blue dots with a lower sales score, we will load that design and display it for you.
Lower Sales Solution

Here we have clicked on the blue dot with the lowest sales score. The design is displayed on the left. It is not as good as our best solution.
Higher Sales Solution

If you click on one of the blue dots with a higher sales score, we will not reveal that design. You must find another way to achieve that score.
Navigate right for the next topic.
|
Thanks for the game! This was useful.
| ||
|
|
You're welcome. There is lots more where that came from.
| |

|
|

|
Learn More
- We hope you enjoyed this module and would like to learn more about applications of probability and optimisation.
- Please visit our website at SUTD Engineering Systems and Design