The Hospital Patient Flow Game

|
I don't get it.
| ||
|
|
It's an 'in-joke'. You need to have heard of Little's Law before.
| |

|
|

|
What's the Joke?
The punchline in the cartoon is:
$L=\lambda W$This formula, known as 'Little's Law', is familiar to anyone who has studied operations management. It expresses a fundamental relationship between average inventory level ($L$), average production rate ($\lambda$), and average flow time ($W$).
The plant manager in the cartoon is surprised that cutting inventories resulted in a drop in his production rate. His assistant knew this would happen because of Little's Law. To keep the same production rate, with lower inventories, it is necessary to reduce average flow times. That is why his assistant suggested cutting set-up times, which are part of flow times.
|
I thought we were going to play a game.
| ||
|
|
We will. But the purpose of the game is to help you visualize Little's Law.
| |

|
|
|
The Hospital Patient Flow Game
Our hospital has four treatment rooms:
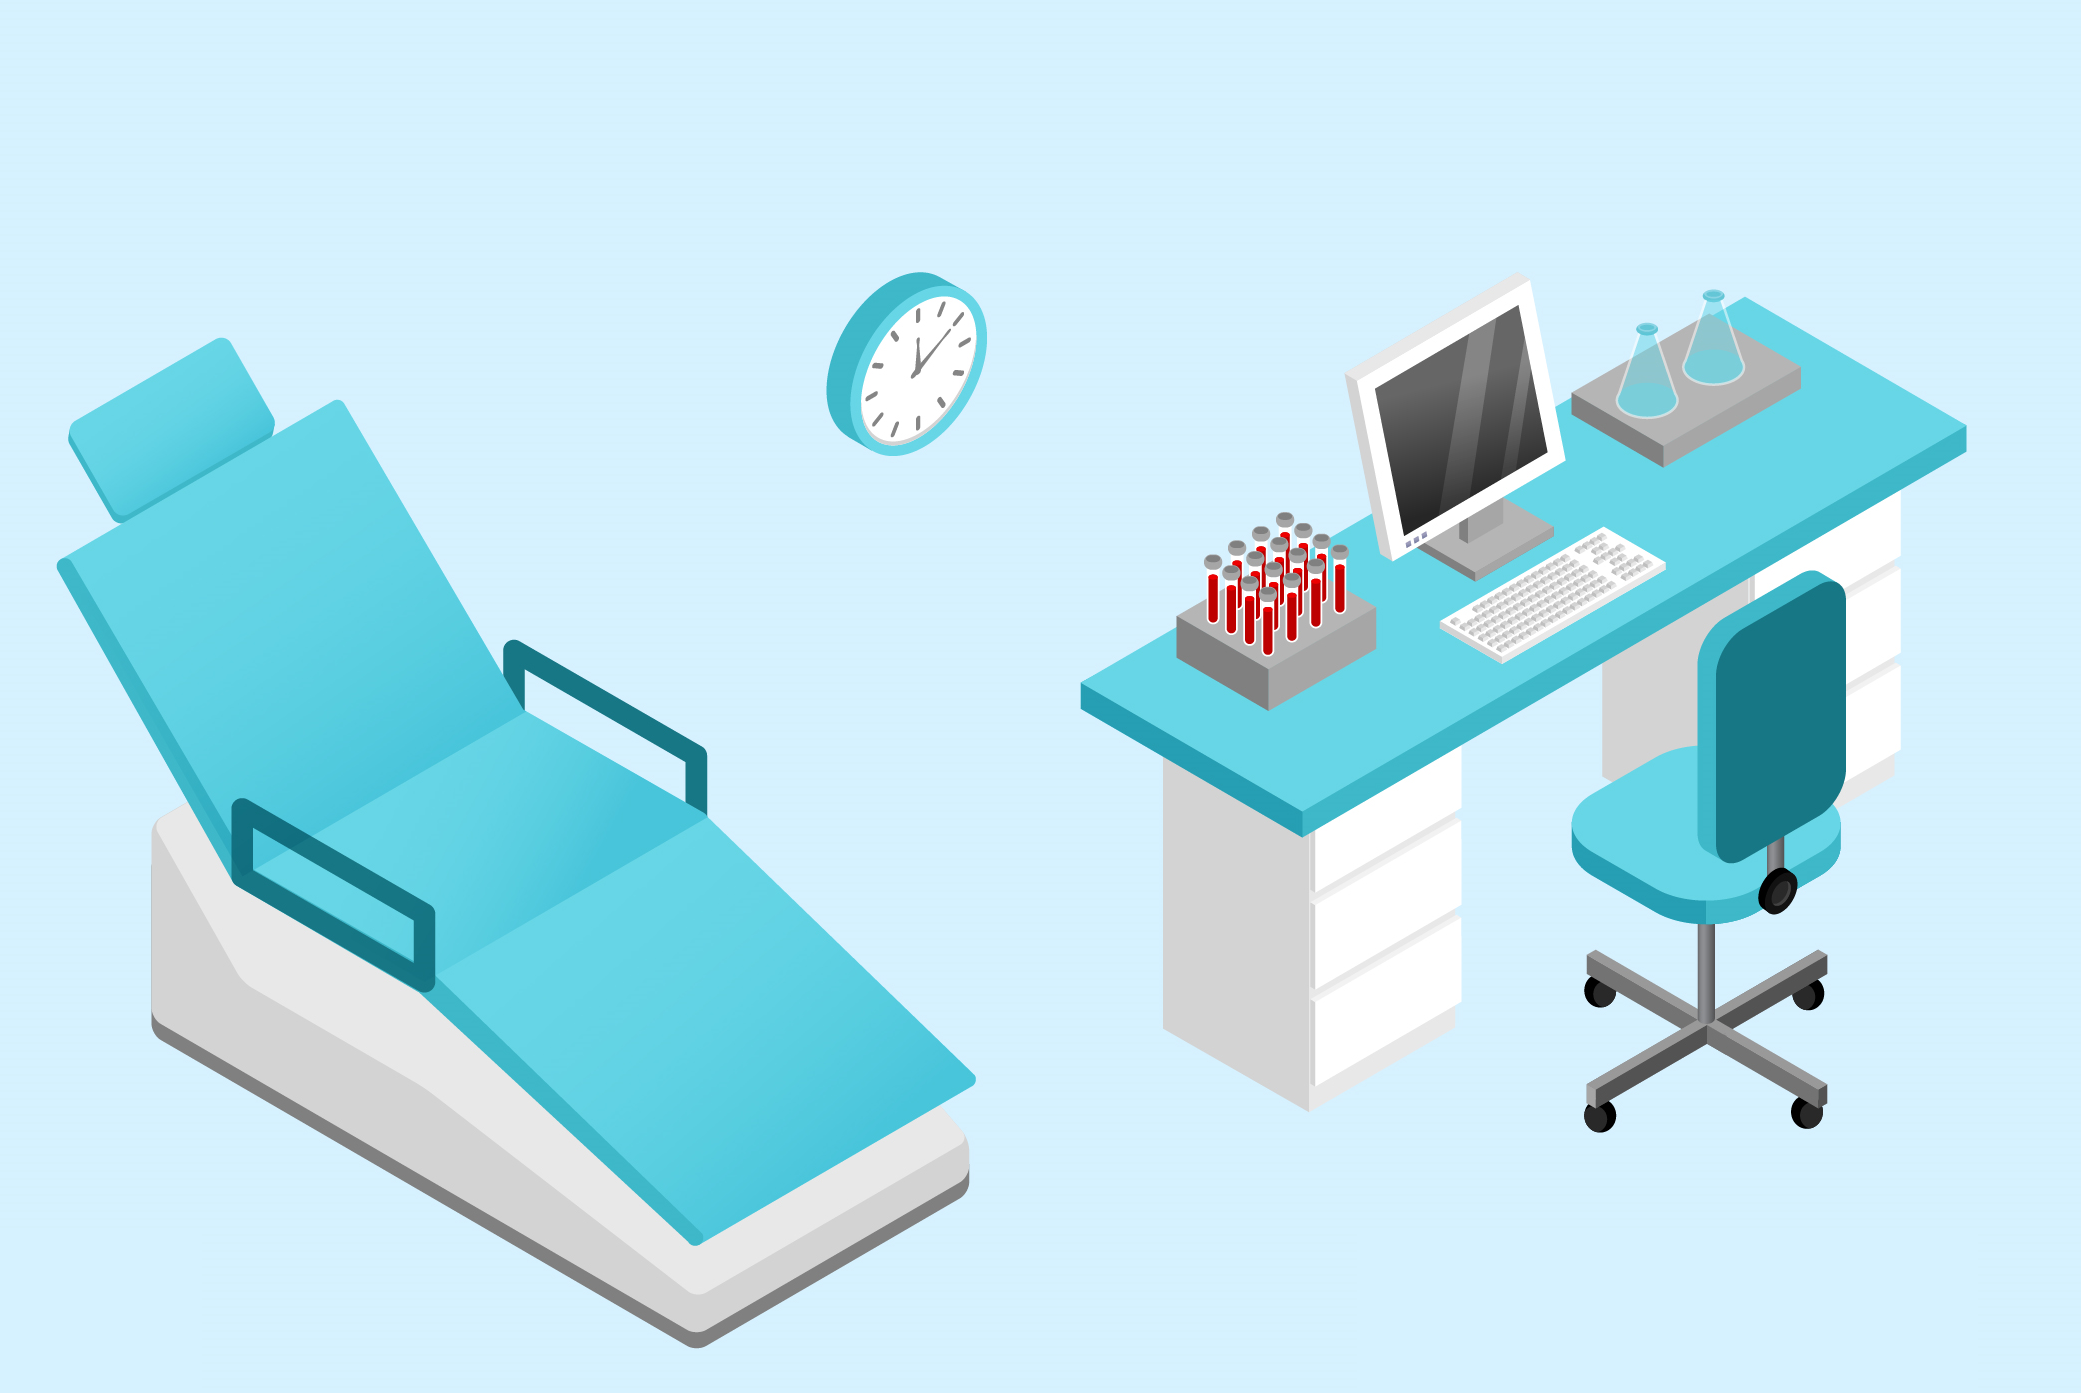
| This is the consultation room. The surgeon meets here with the patient to explain the procedure. |
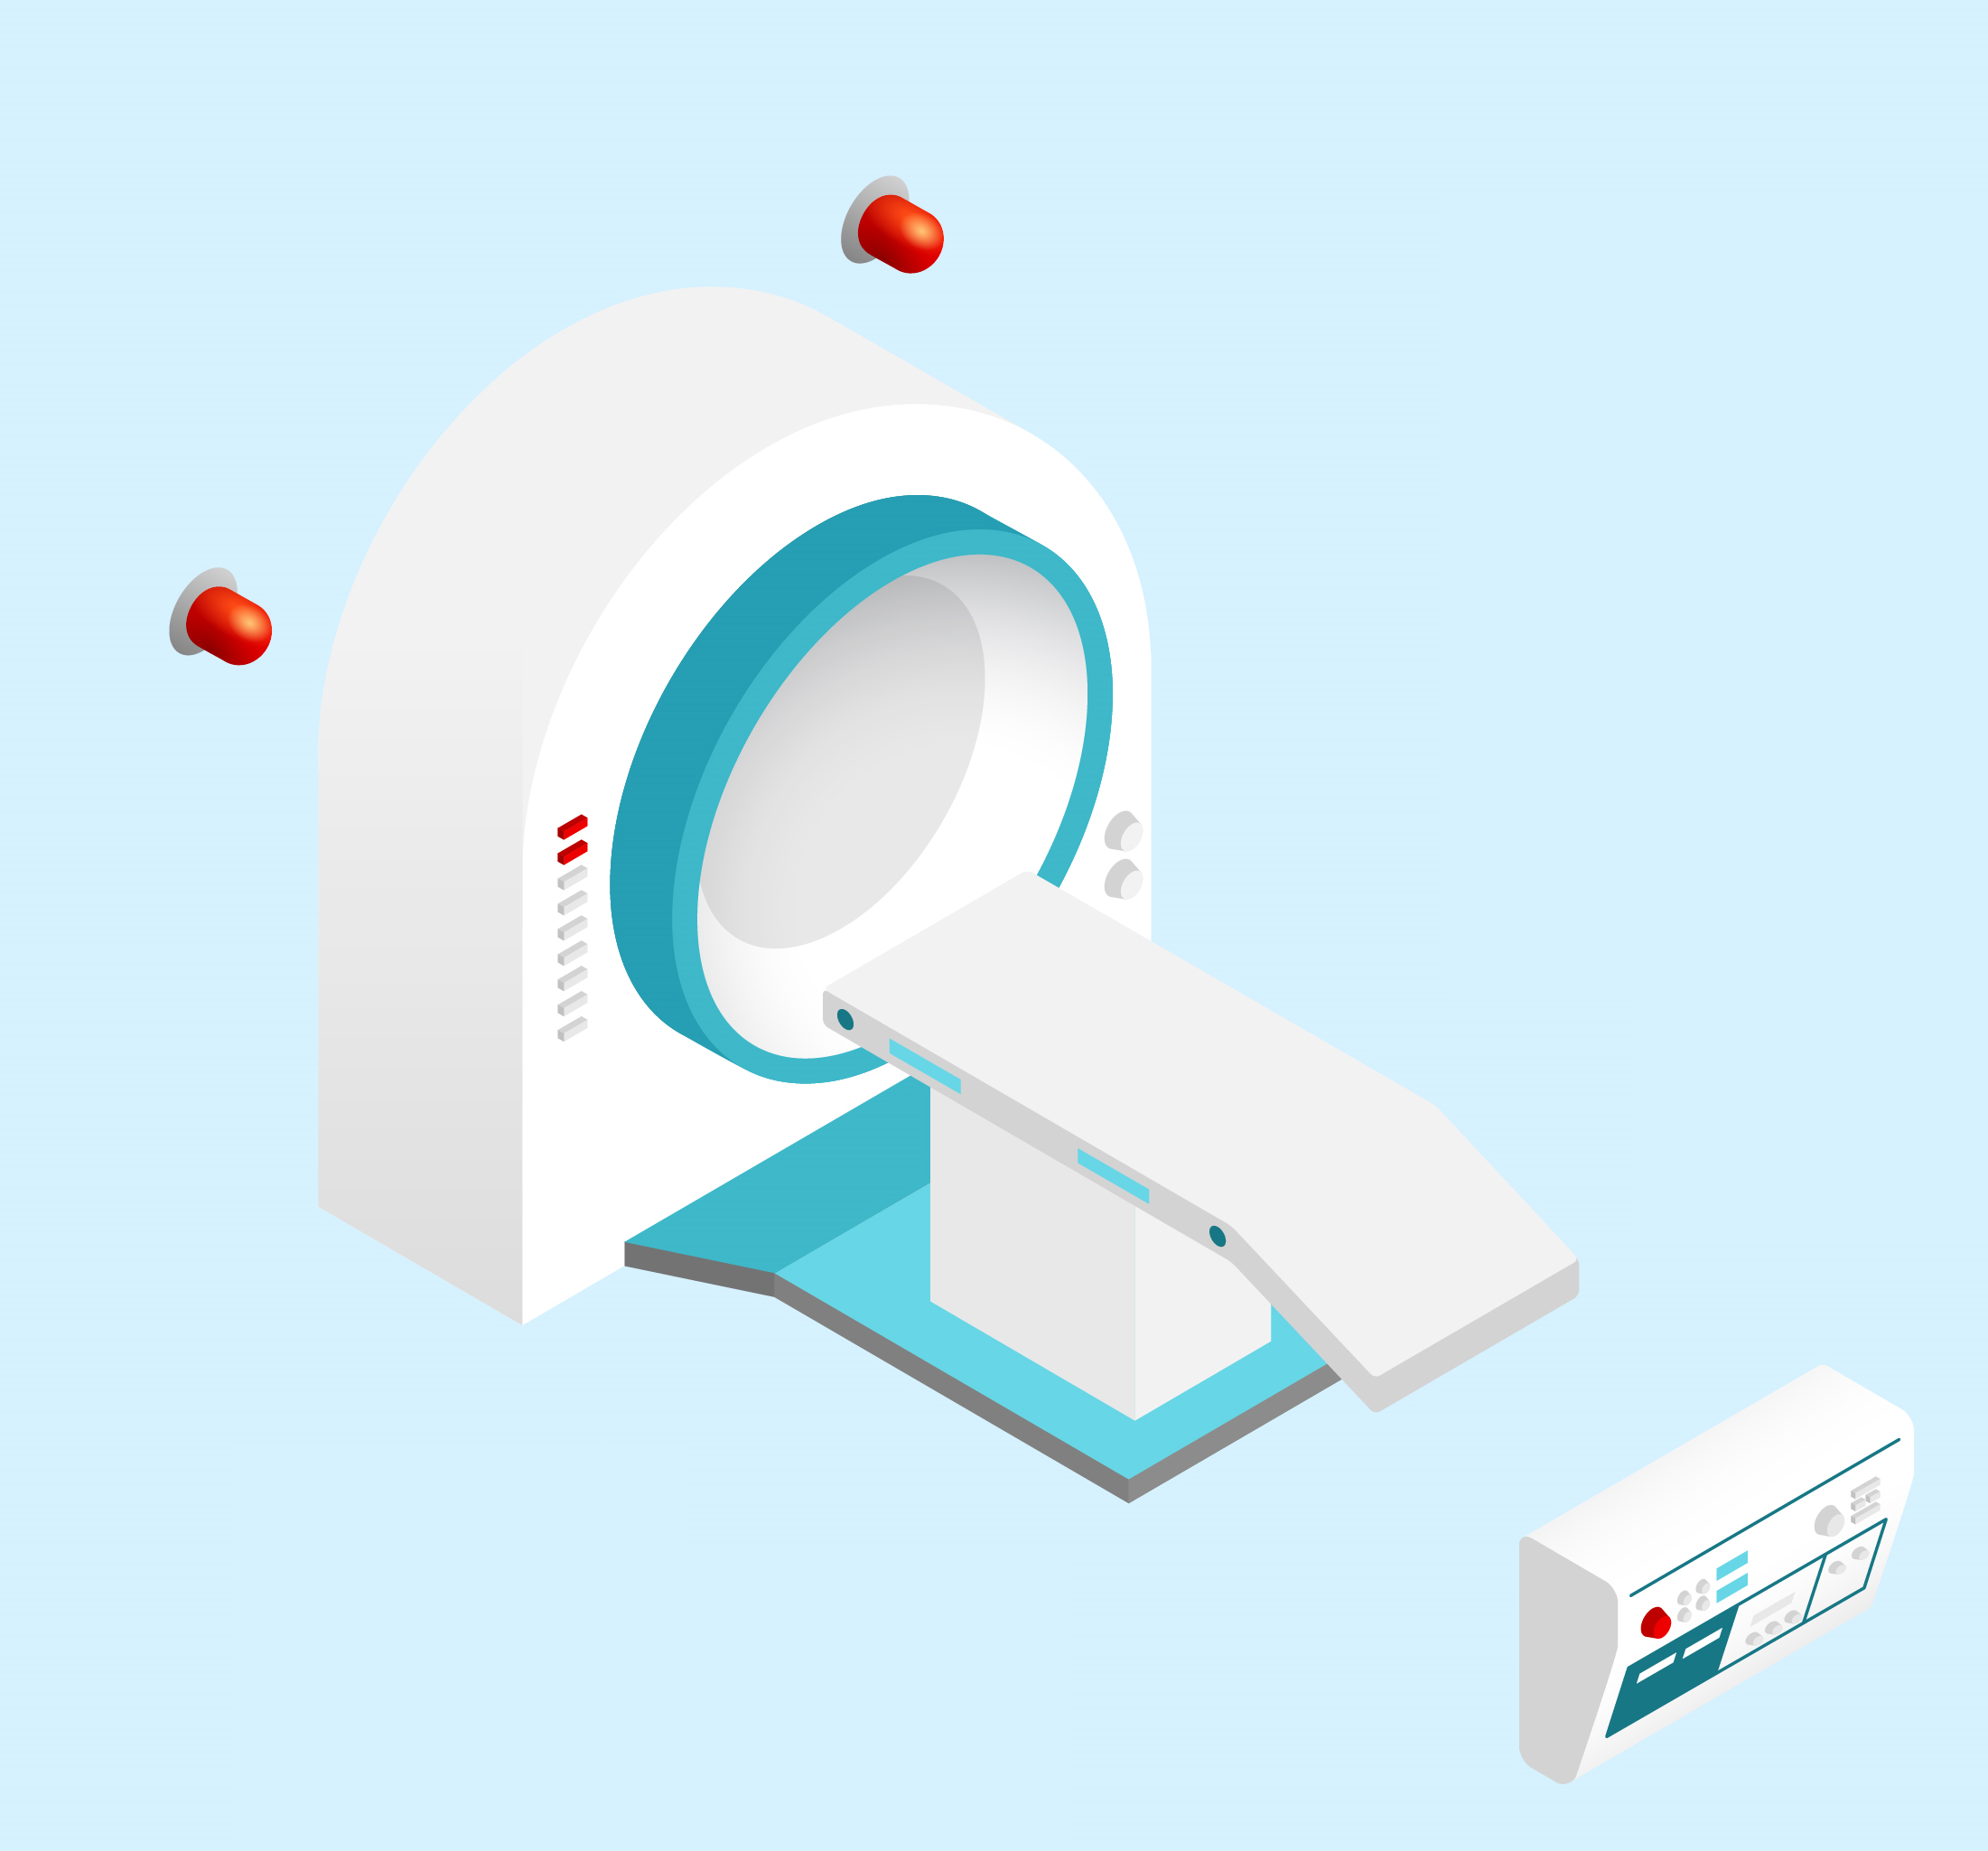
| This is the radiology room. The surgeon requires an up-to-date patient-scan before surgery. |

| This is the surgical operating room. This is where the main procedure is performed. |
| This is the post-operative recovery room. The patient needs time to recover from the surgical anaesthesia. |
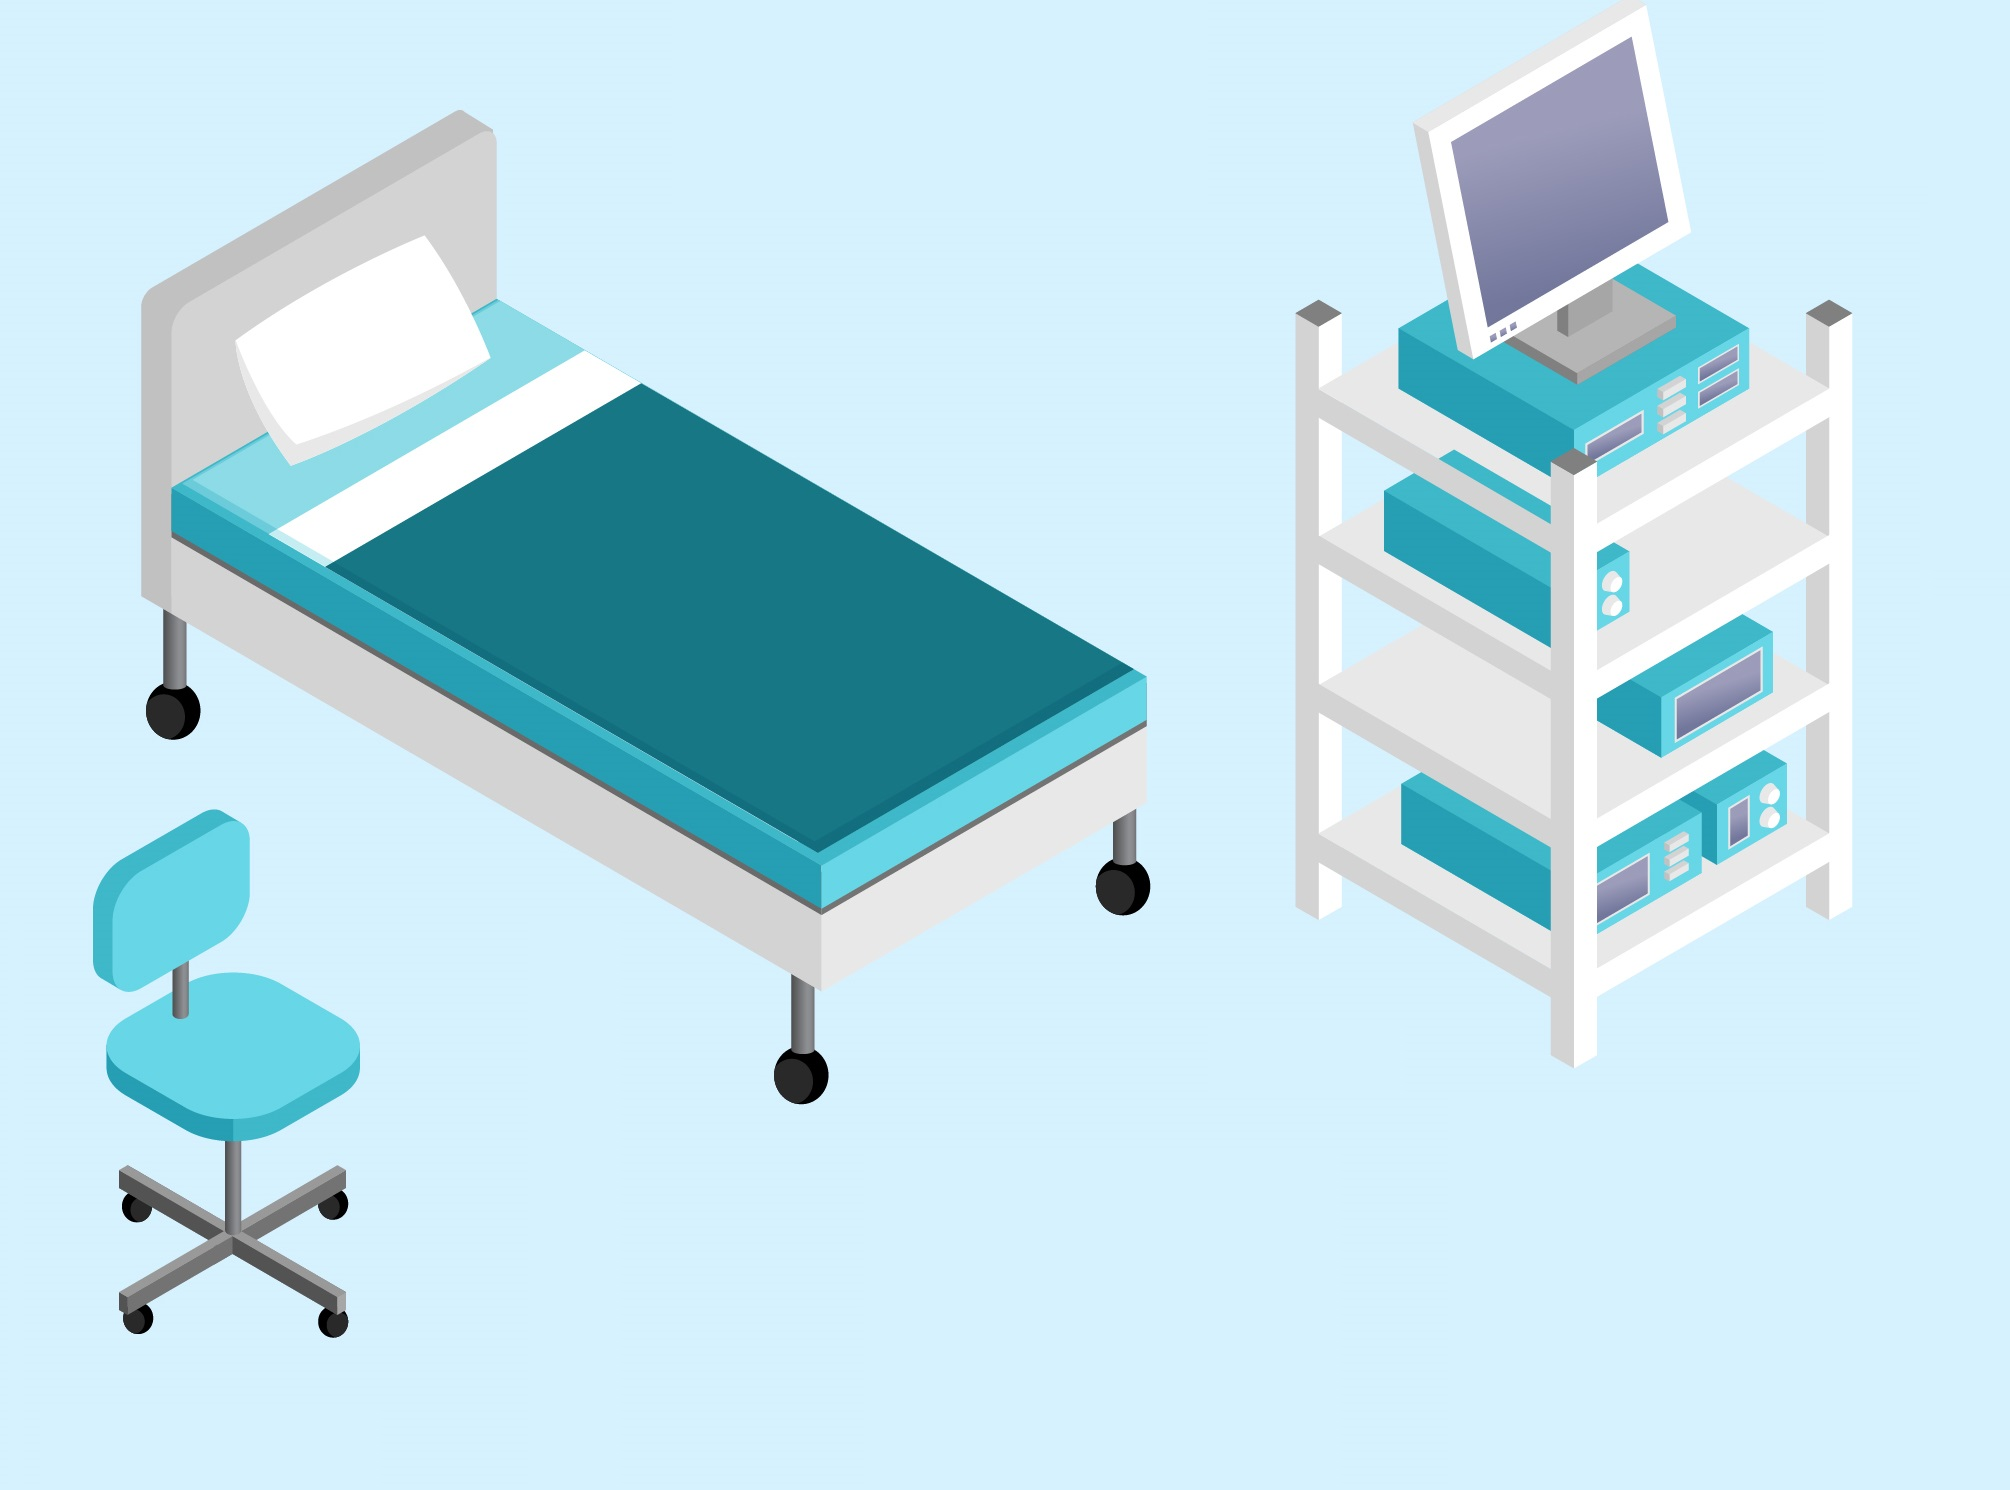
Non-Treatment Rooms
Patients can be in two other rooms without limit:
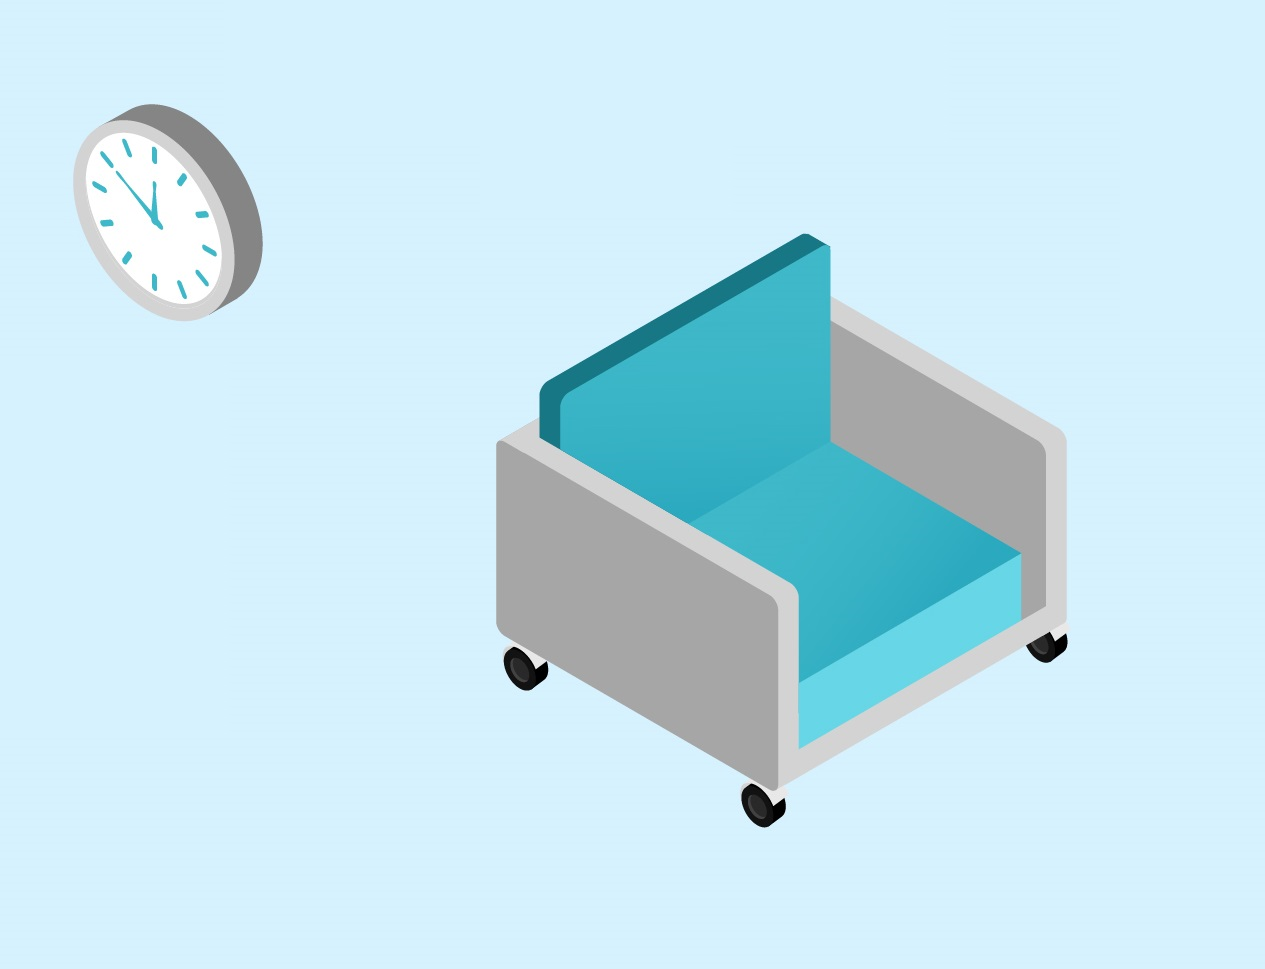
| Patients enter the hospital through the waiting room. There can be several patients here at once but they are admitted to the hospital surgical area one at a time. |
| This is the ward. There can be several patients here at once. For our purpose, a patient has effectively left the hospital surgical area once he or she enters the ward. |
Your New Job
You are in charge of transporting patients through our hospital.
| You are to move patients through the hospital surgical area as quickly as possible. If a patient has finished in a procedure room, you should move him or her to the next room promptly. No one else can use the room while it is occupied. |
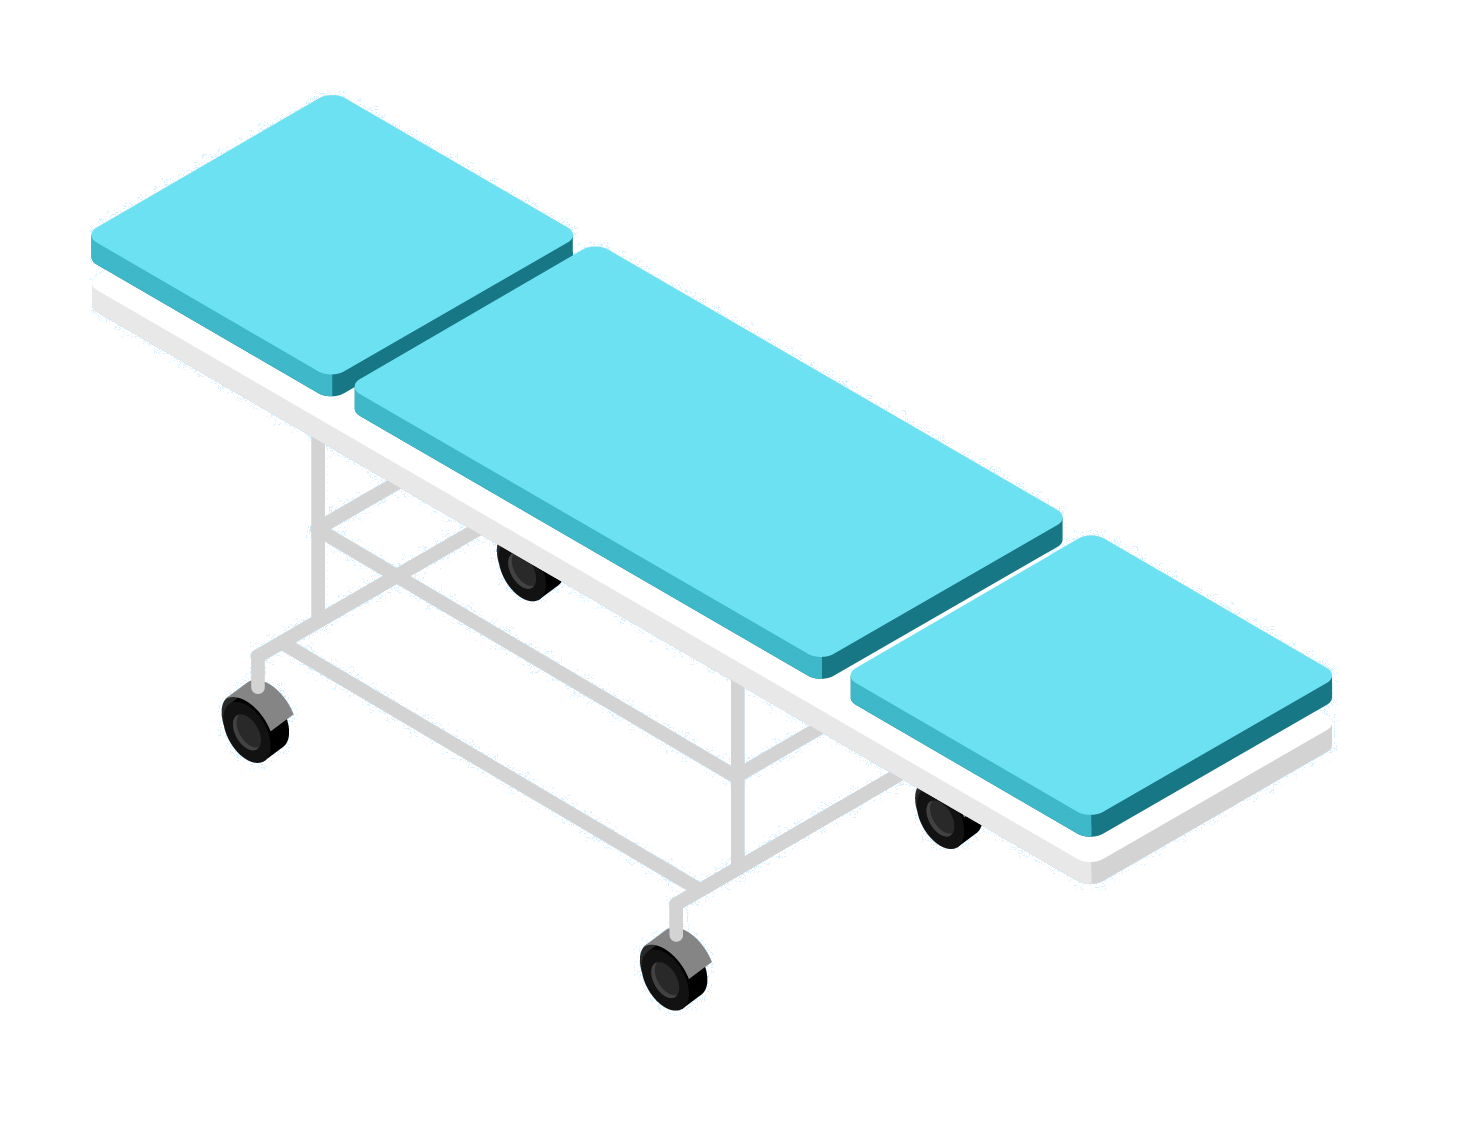
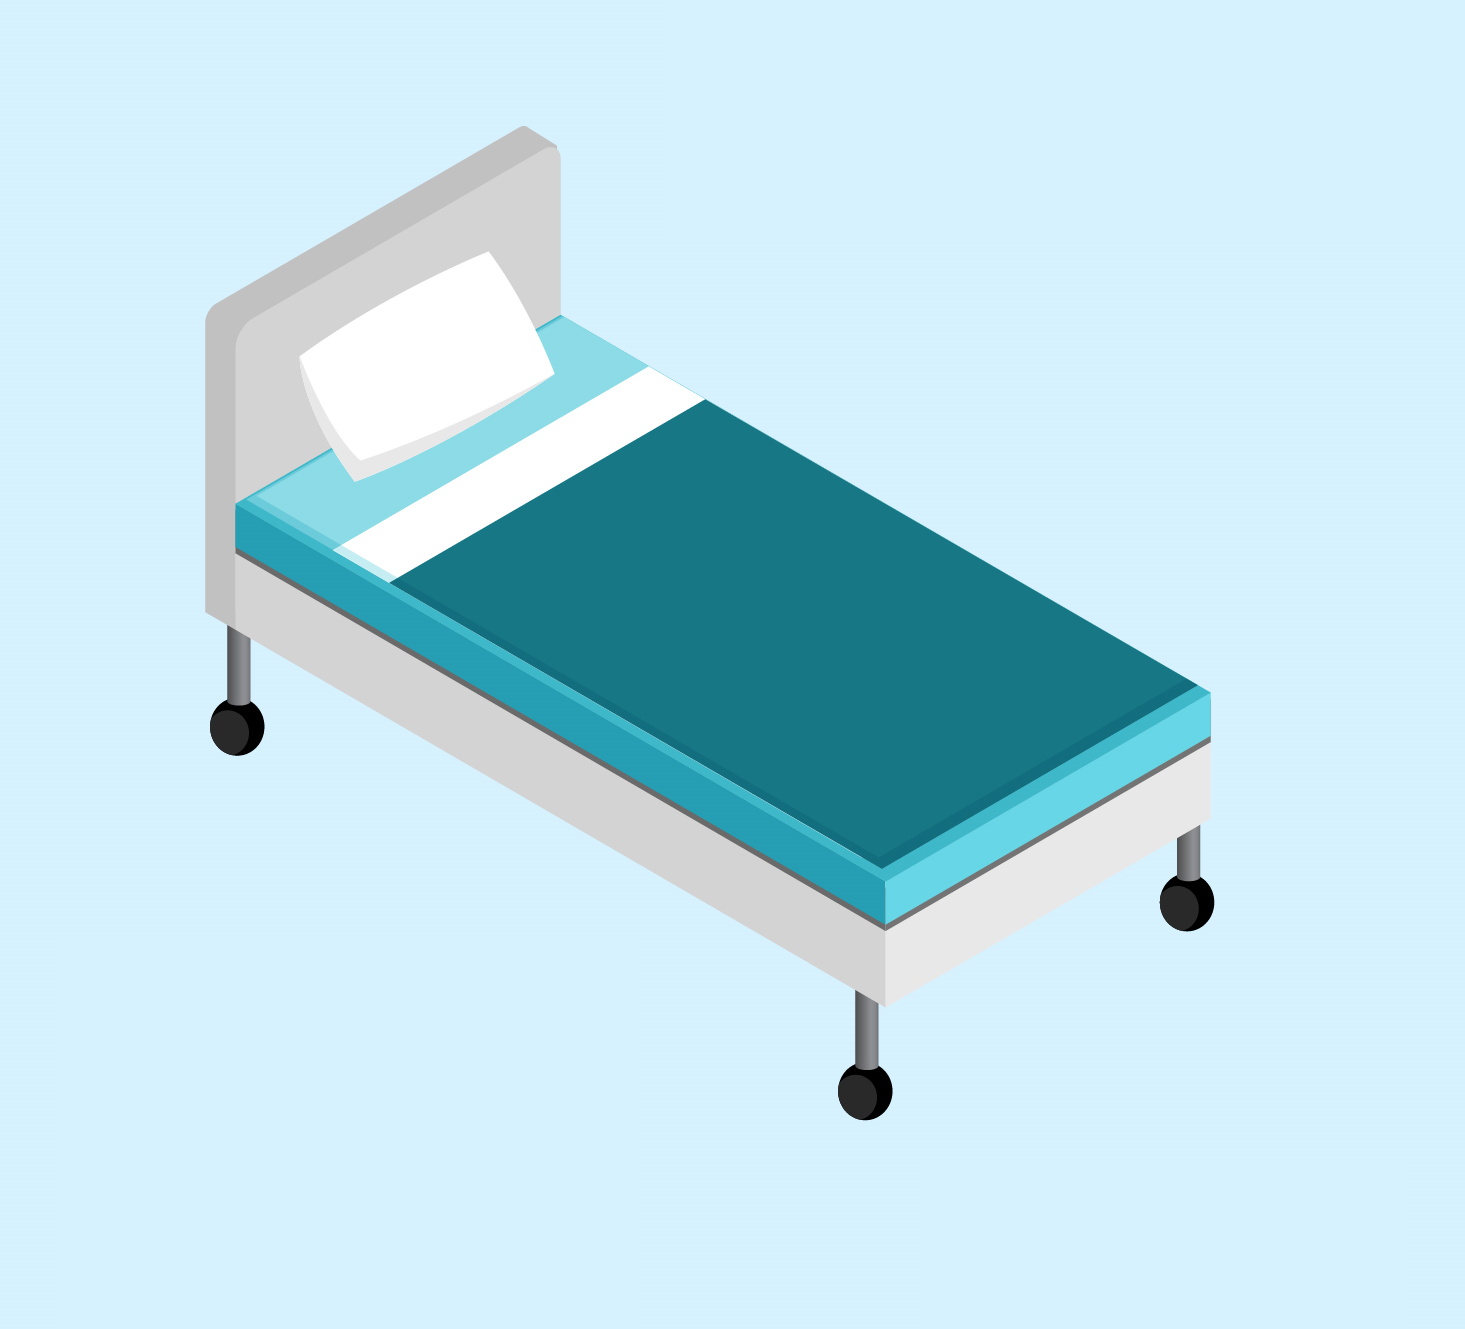
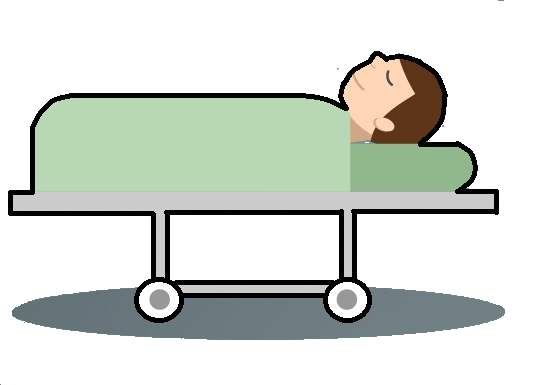
| Use a gurney to move a patient. Just drag the gurney close to the patient and we will transfer the patient to the gurney. Then drag the patient (on the gurney) to the center of the next treatment room. We will transfer the patient to the room. |
When Can A Patient Be Moved?
|
| When the patient is being processed for admission (in the waiting room) or being treated (in one of the treatment rooms), the patient will appear without a circle around him. You will NOT be able to move a patient in this state. |
|
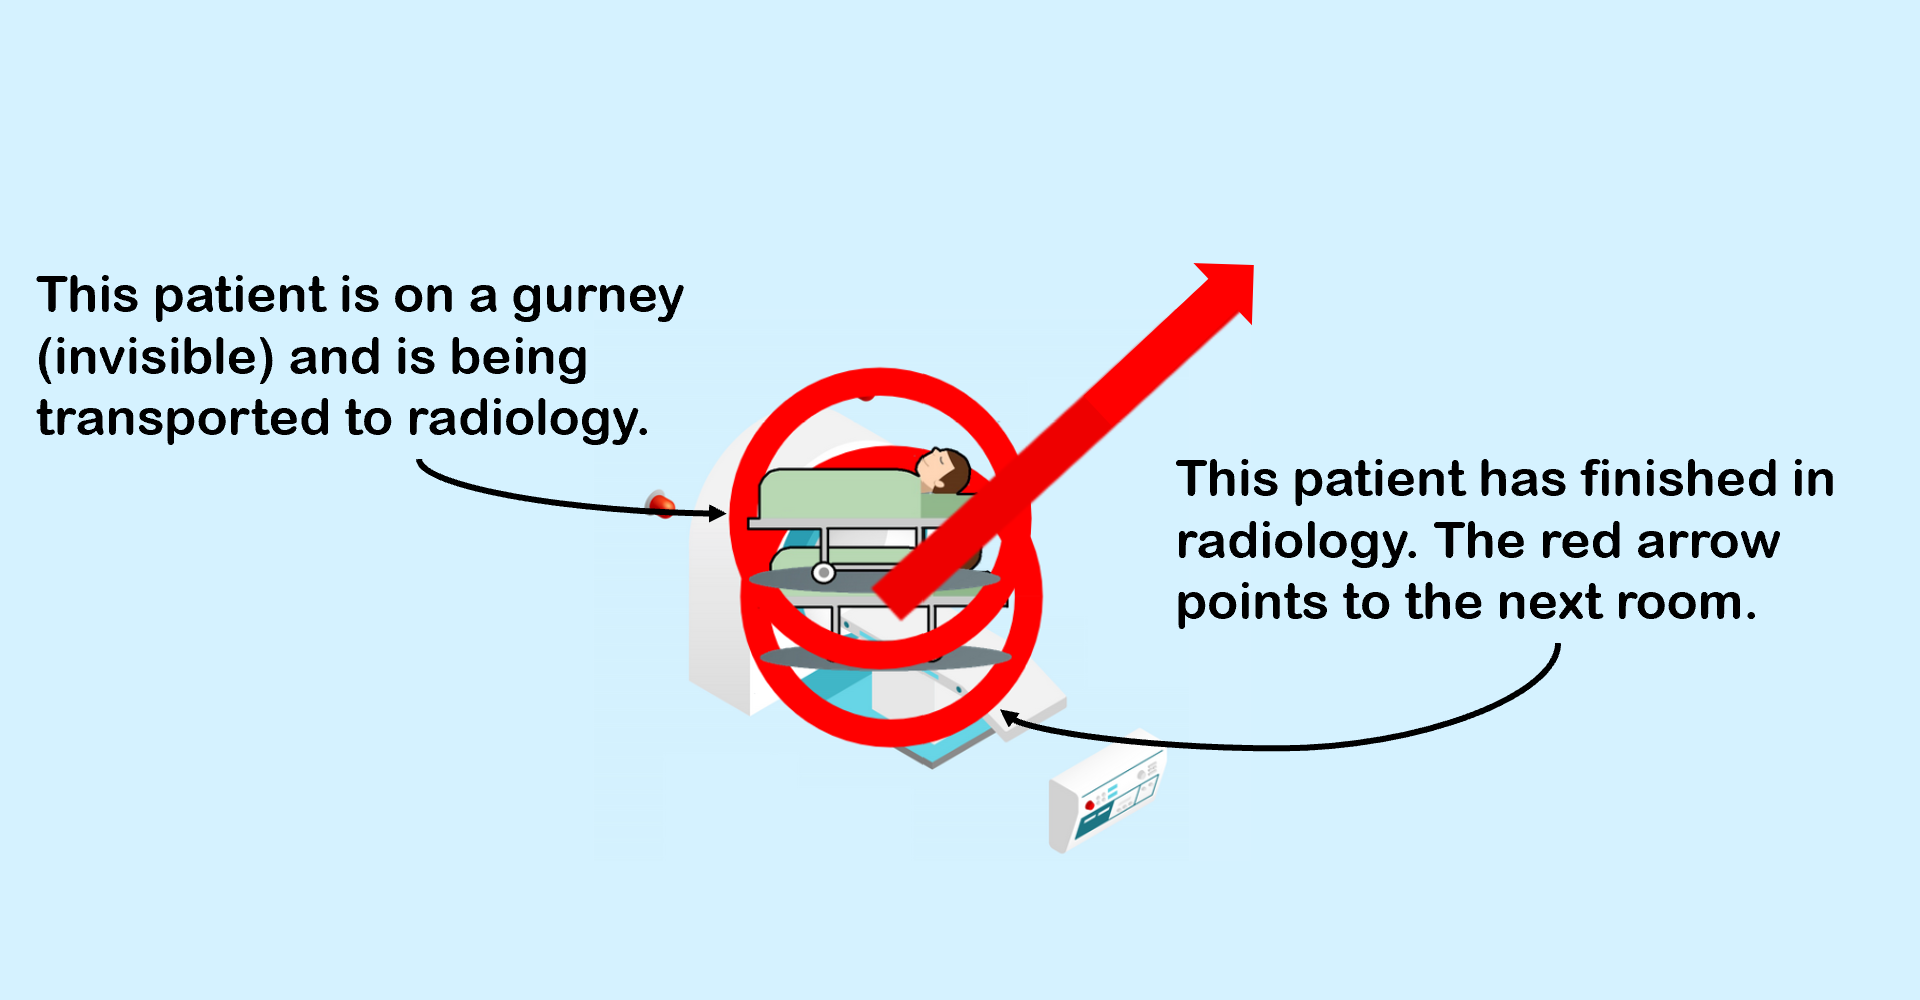
| A big red circle appears around a patient when he is ready to be moved. You must take the patient to the next treatment room. A big red arrow points to the room. |

| The arrow will not appear if there is another patient in the next room. You can still transport the patient even though the arrow is not visible. |
A Nice Trick
Recall that we will take the patient off your gurney and put him into the room if you get close enough to the center of the room. If there is a patient waiting in that room, we will also put that patient onto your gurney for you. So you can drop off and pick up patients without ever lifting a finger.
|
Sounds like work. How many patients do I have to transport?
| ||
|
|
Just five patients. For game purposes, we have made the treatment times (unrealistically) short. You will have to be quick to keep up.
| |
|
|
|
|
|
Okay, sounds fun! What is the goal? How do I win?
| ||
|
|
That depends on your instructor. I would ask you to compete twice, for two different goals.
| |
|
|
|
|
Two Ways to Play
Your instructor may ask you to compete for different goals.
- Maximize the throughput rate of our hospital surgical area. These are expensive resources and we need to fully utilize them. (This is the score we will record.)
- Minimize the average patient flowtime. These are very important people and we must minimize the time they spend with us. (This will be recorded but not as "score".)
|
Where can I see those scores in the game?
| ||
|
|
When you get to the end of the game, click the "Flow" button and look for the two quantities "Average Patient Flowtime" and "Throughput Rate".
| |
|
|
|
|
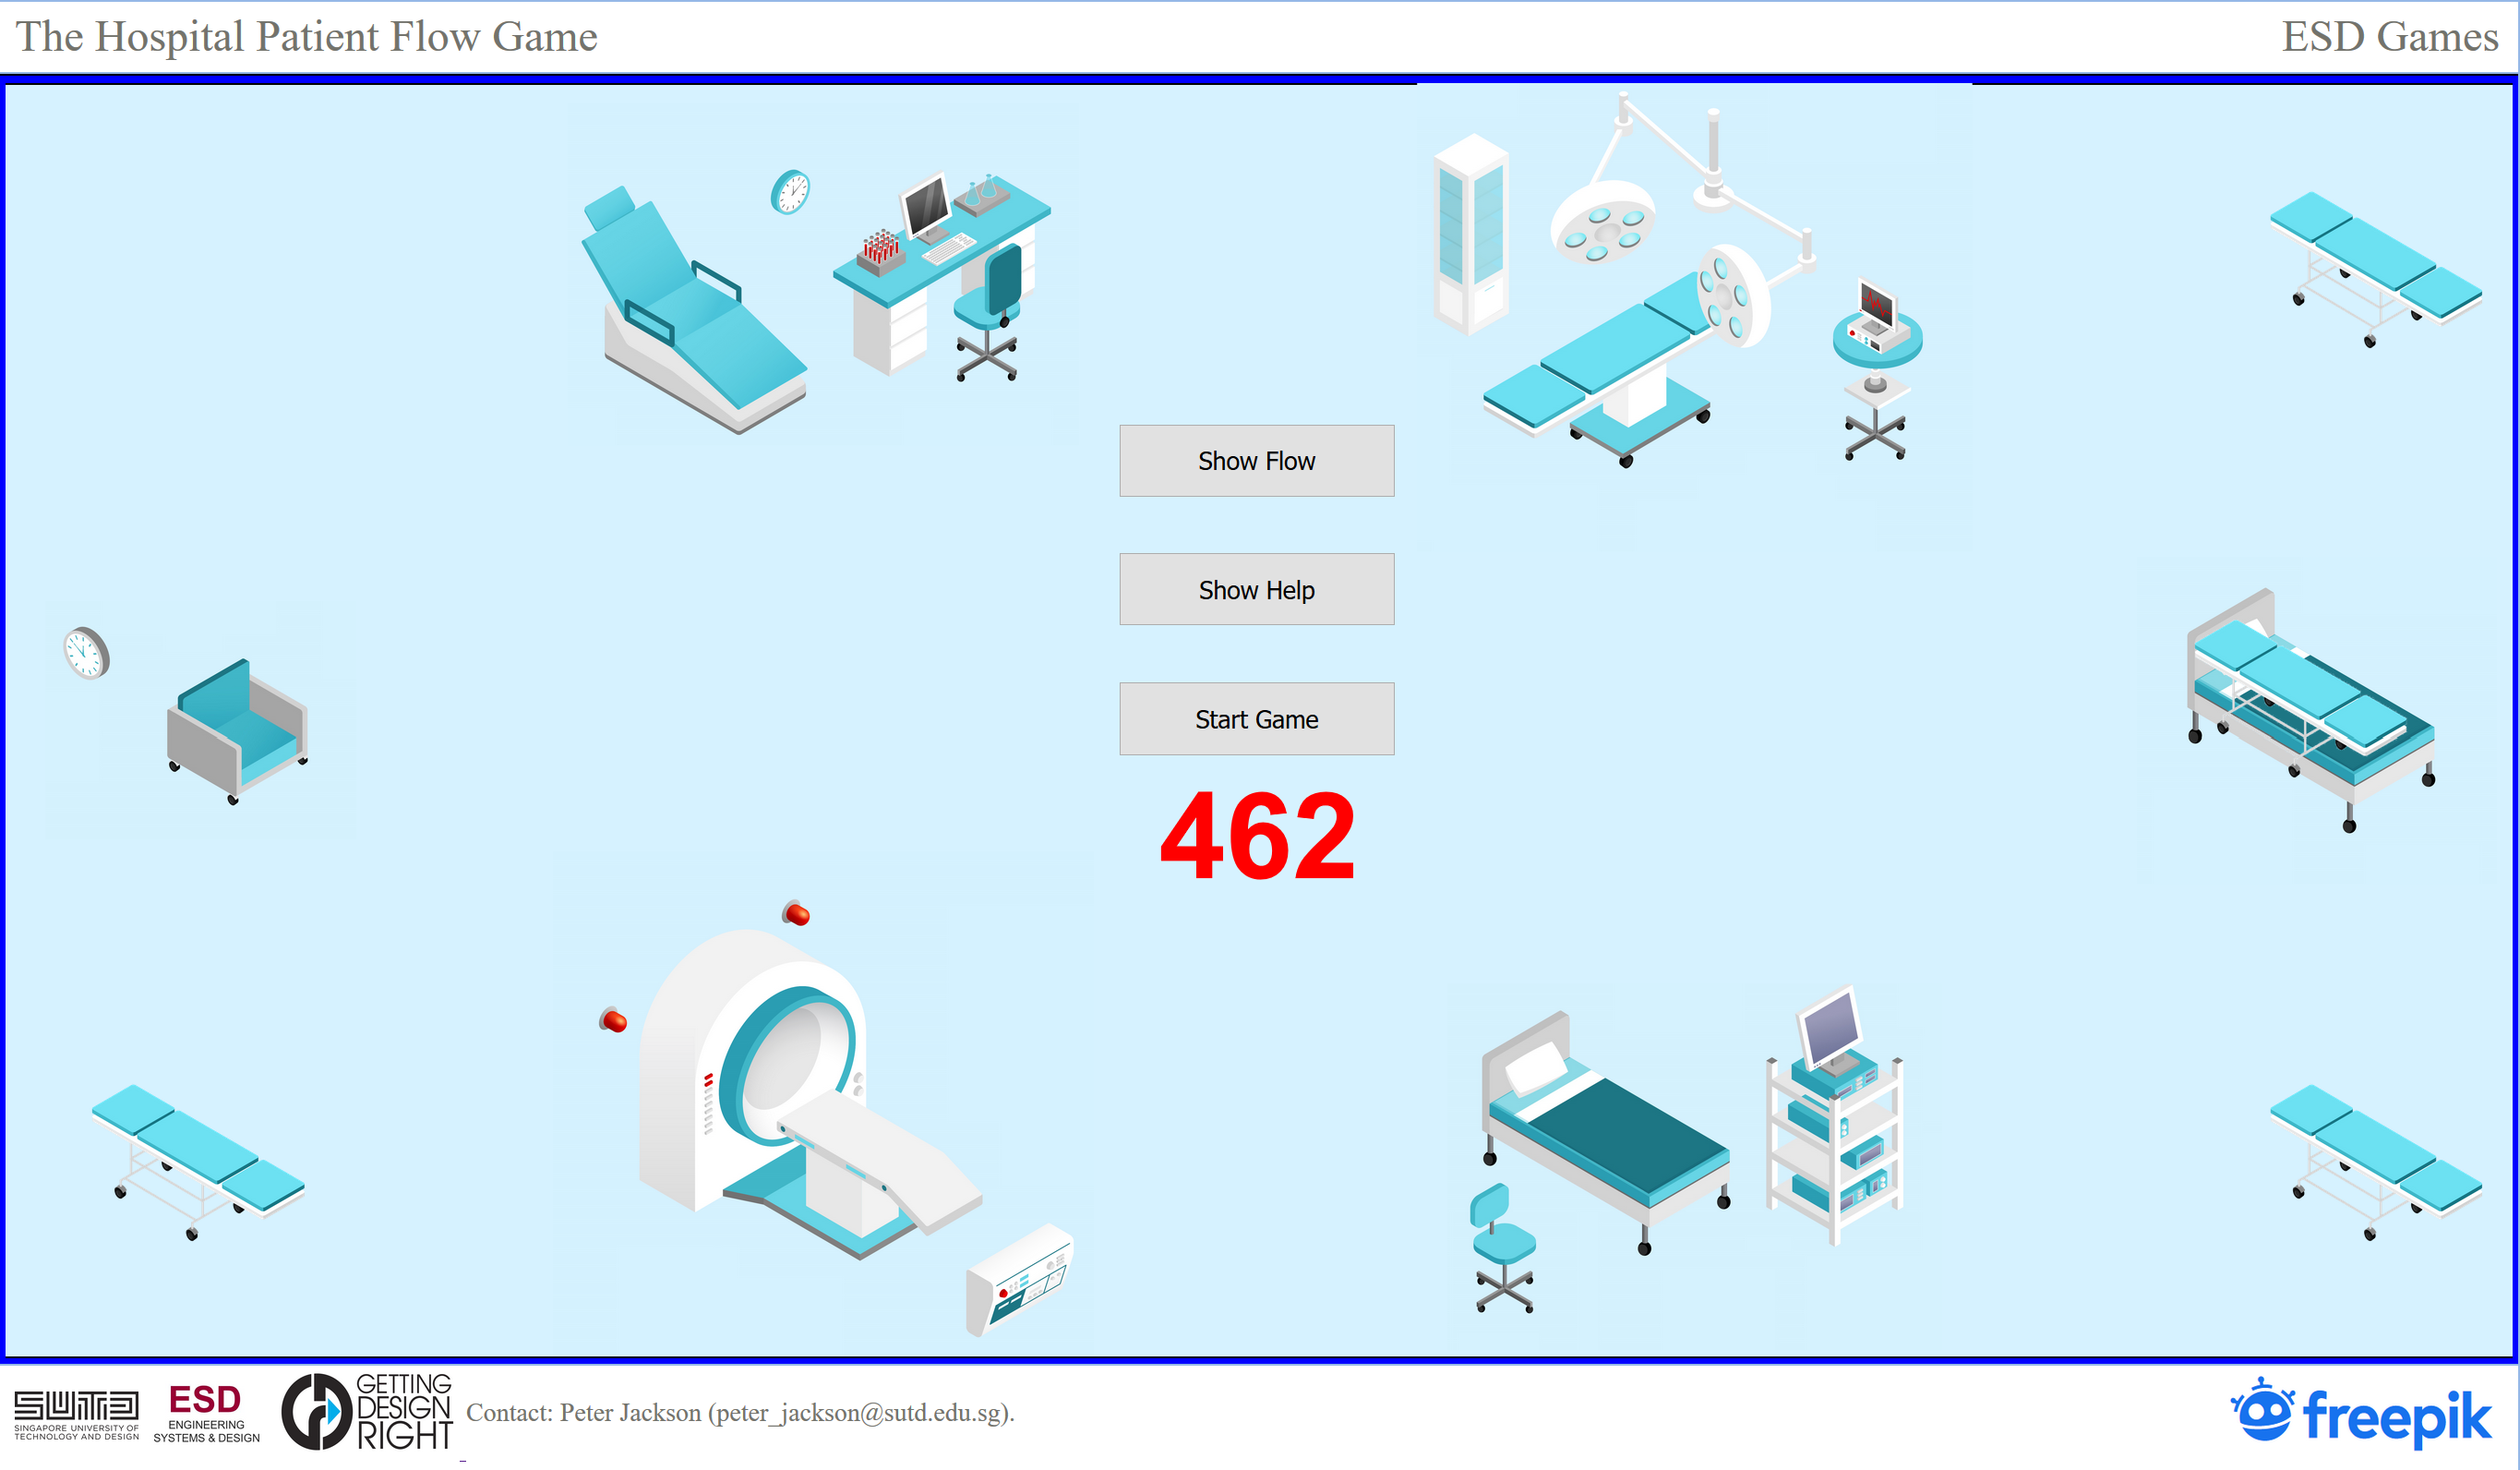
Ready to Play
Click the link to open the game in a new browser window. Come back here after you play for more explanation.
The Hospital Patient Flow GameWelcome Back
We hope the game made sense to you. You likely had to practice to get the hang of how the patient transport system works.
In the next slides, we explain the advanced features of the game and demonstrate the relevance of Little's Law.
These are nested slides, so to skip a topic navigate to the right. To step through a topic, navigate down.

Minimize Flowtime
Let's step through playing the game with the motive of minimizing average patient flowtime.
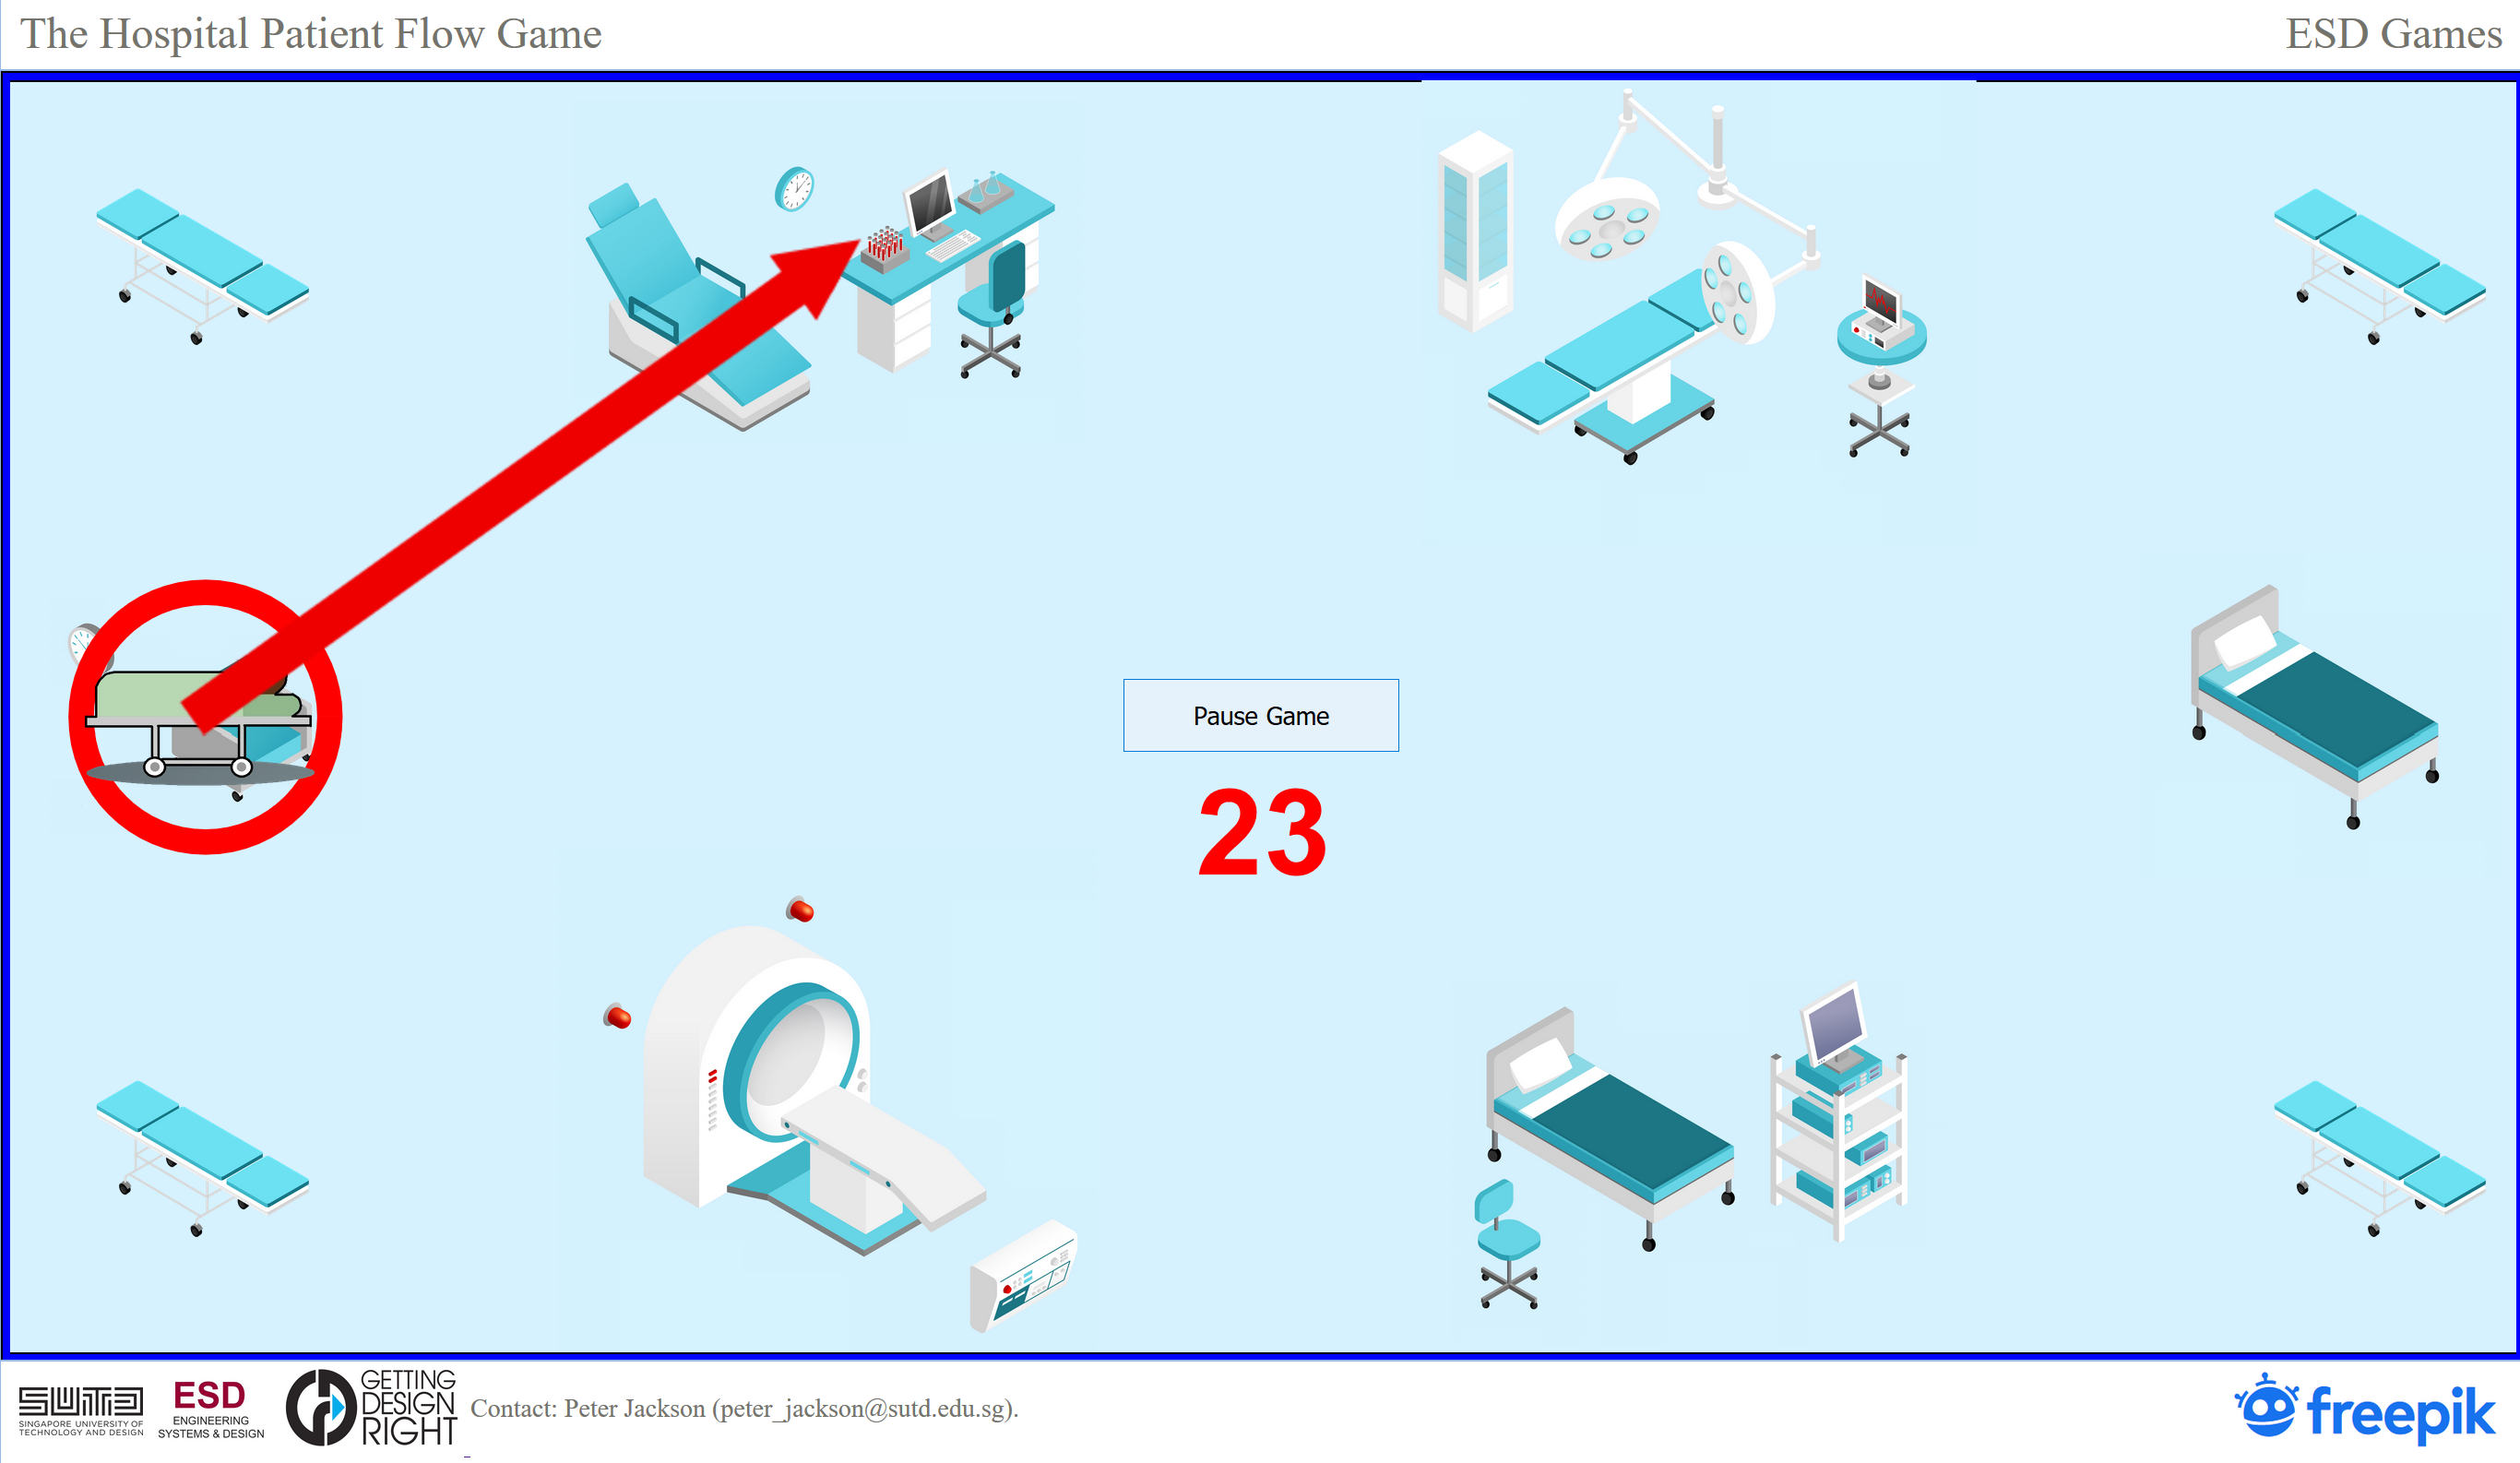
After clicking the start button, the first patient is ready to move at about 23 time ticks. (We call the units of time "time ticks." Let's assume one day is 1000 time ticks.)
Minimize Flowtime
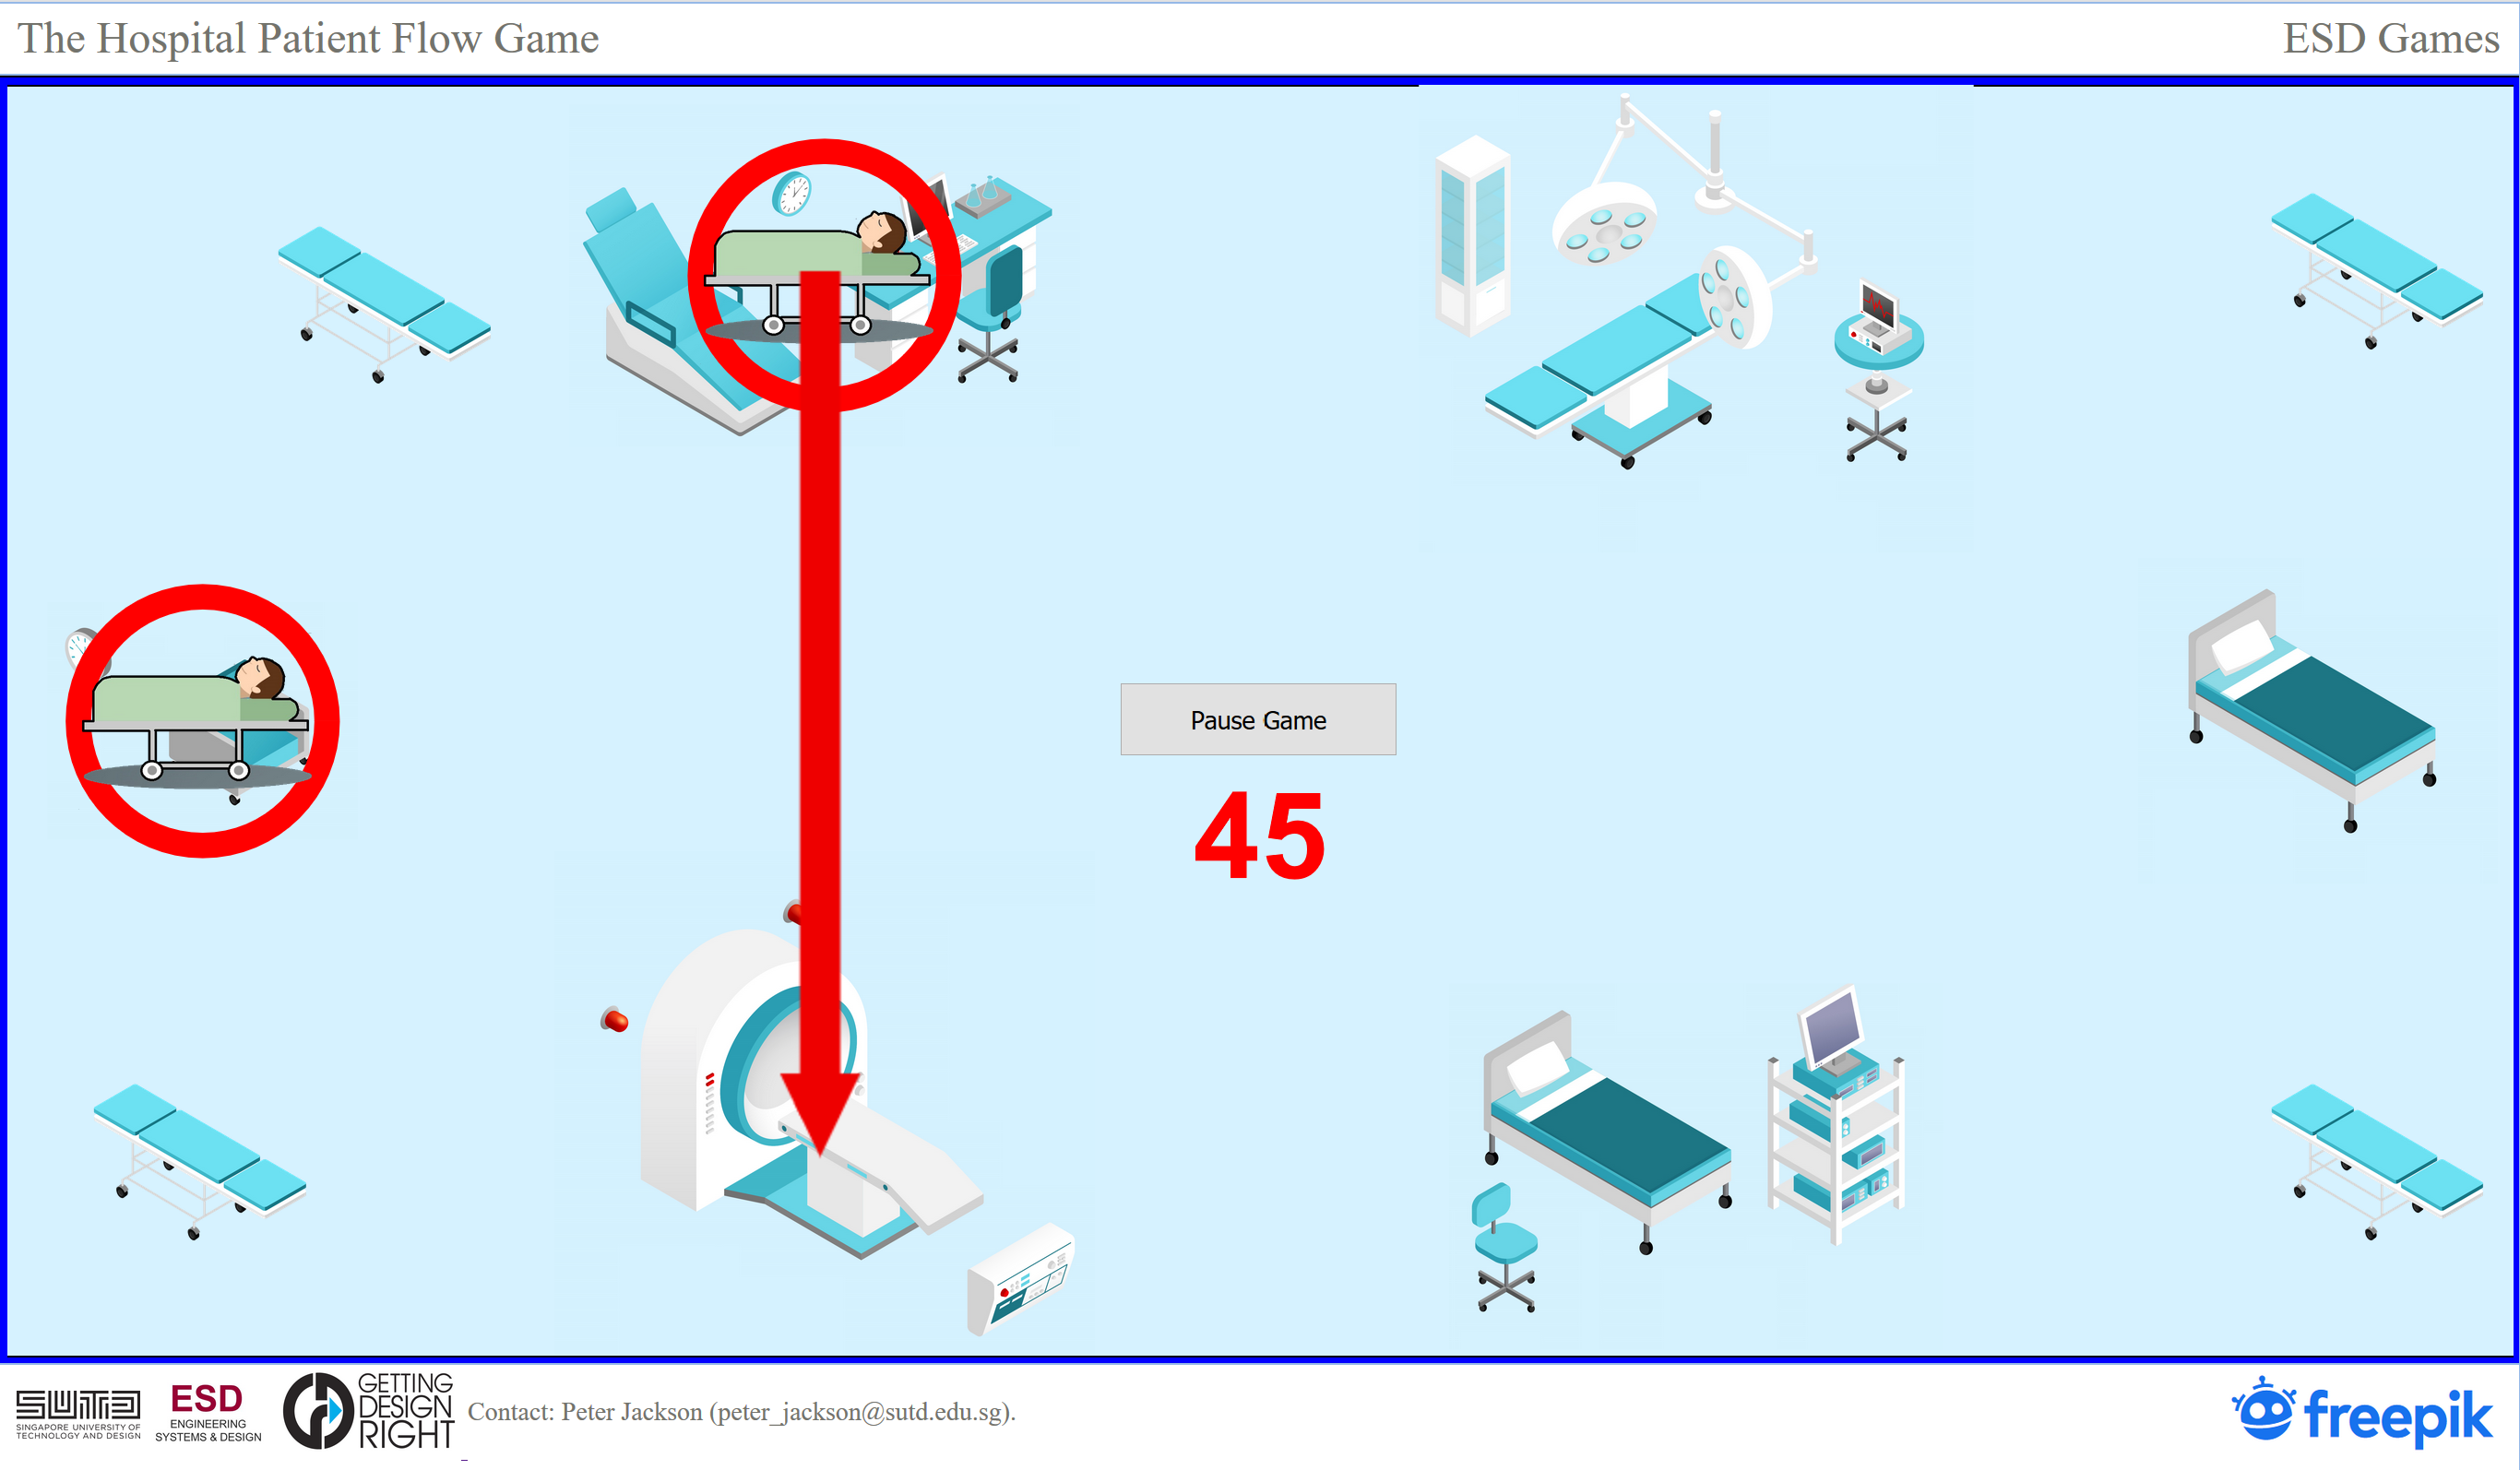
We transport the first patient to the Consultation Room and we wait for the consultation to finish. That happens at about 45 time ticks.
The second patient is ready to move from the waiting room but we will ignore him. We are focused on getting the first patient through as fast as possible.
Minimize Flowtime
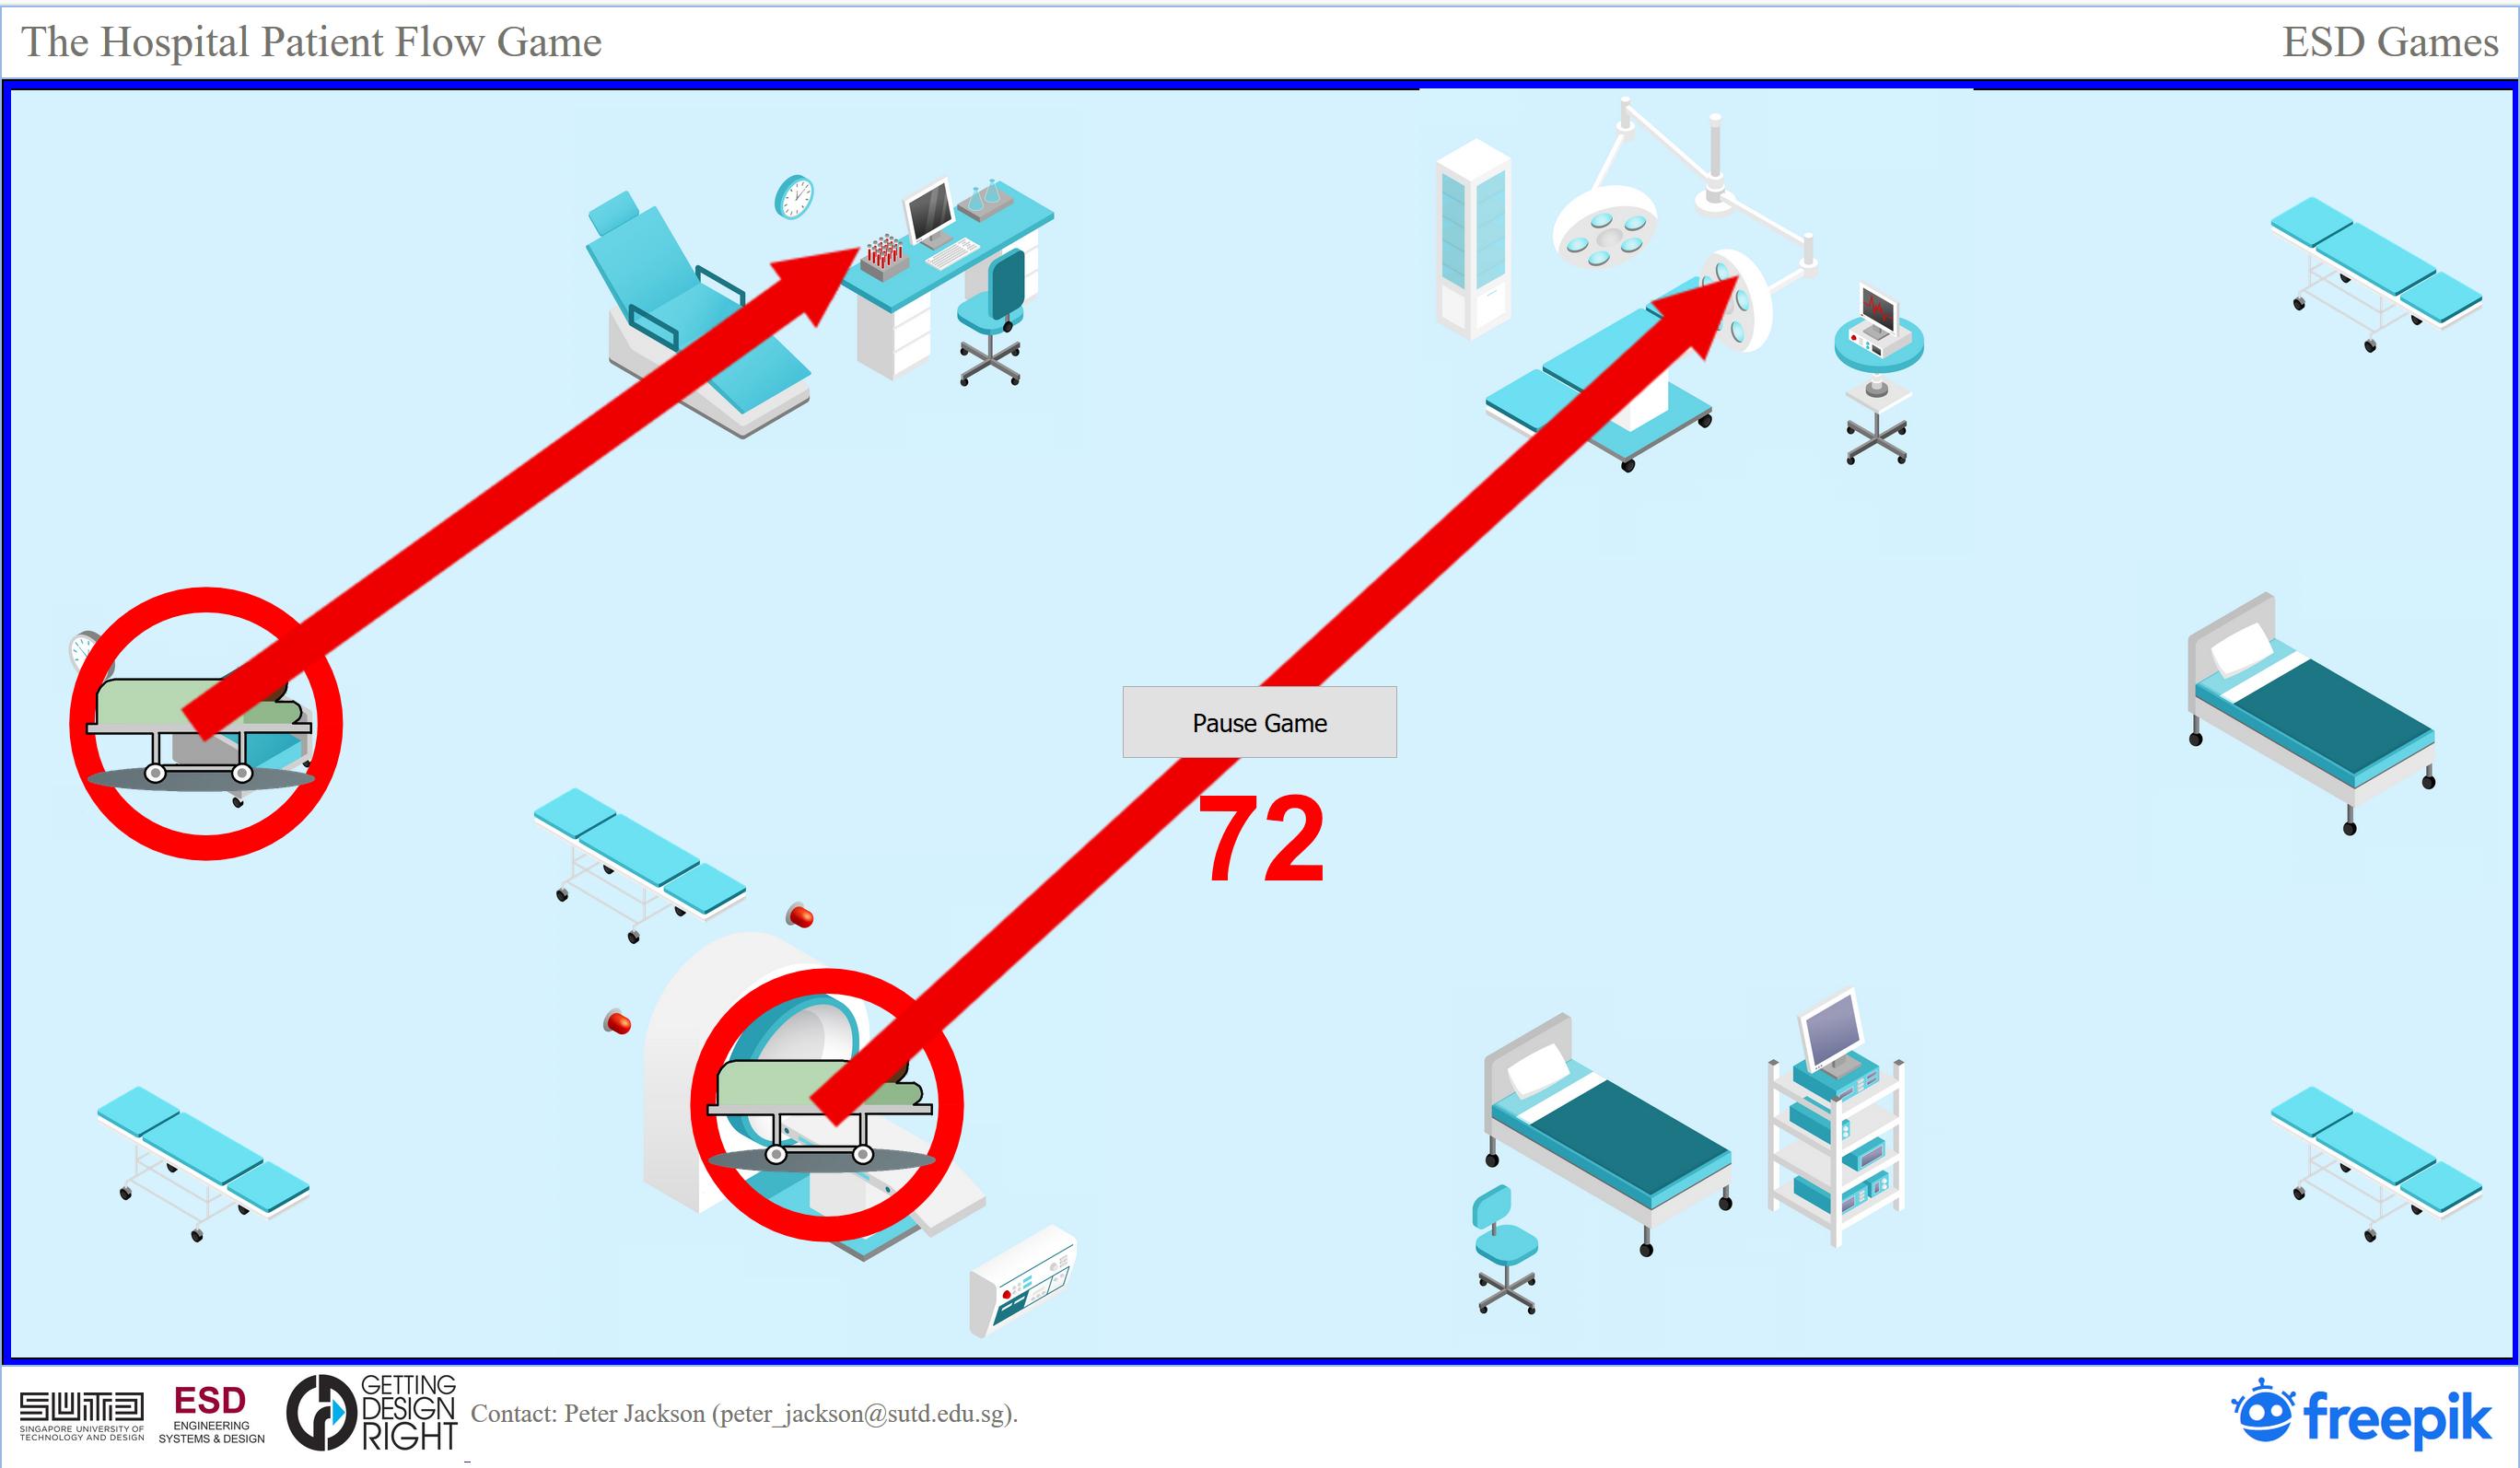
We transport the first patient to the Radiology Department and we wait for the patient-scan to finish. That happens at about 72 time ticks.
The second patient is still in the waiting room but now an arrow shows up to the Consultation Room. That is because the Consultation Room is now empty and is ready for a new patient.
Minimize Flowtime
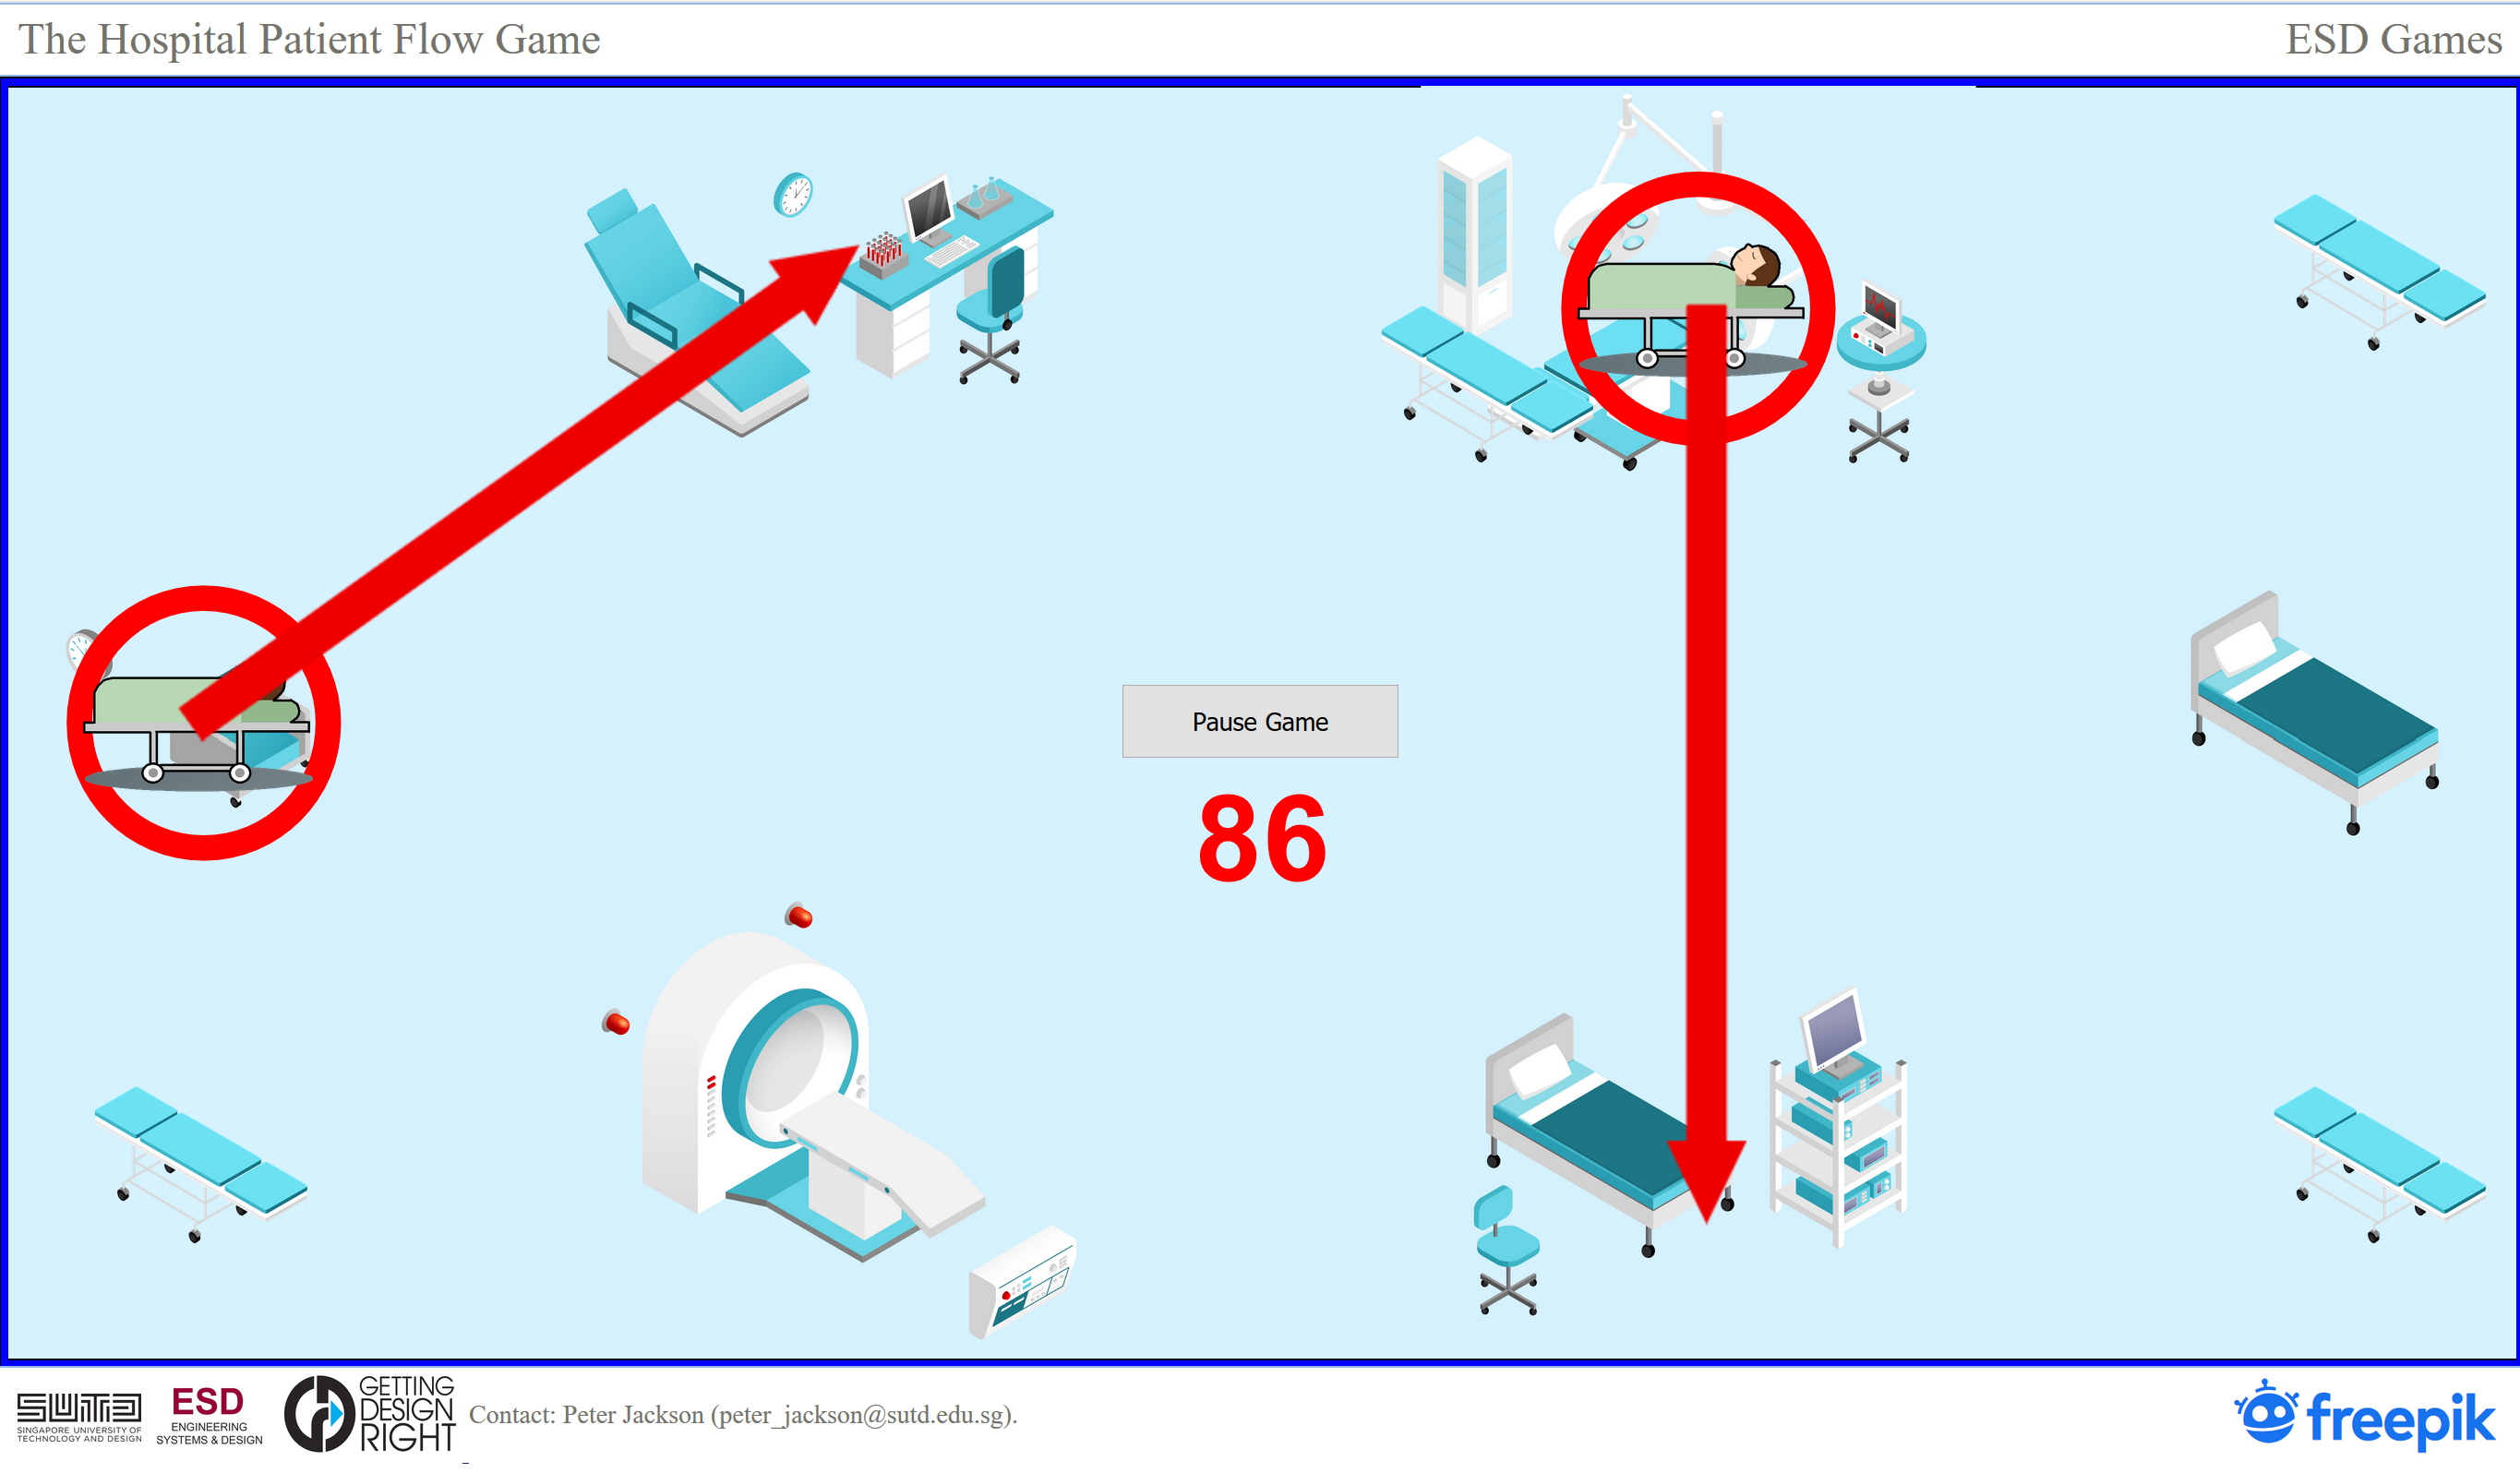
We transport the first patient to the Surgical Operating Room and we wait for the surgery to finish. That happens at about 86 time ticks. (Yes, these times are unrealistic but it is no fun otherwise.)
Minimize Flowtime
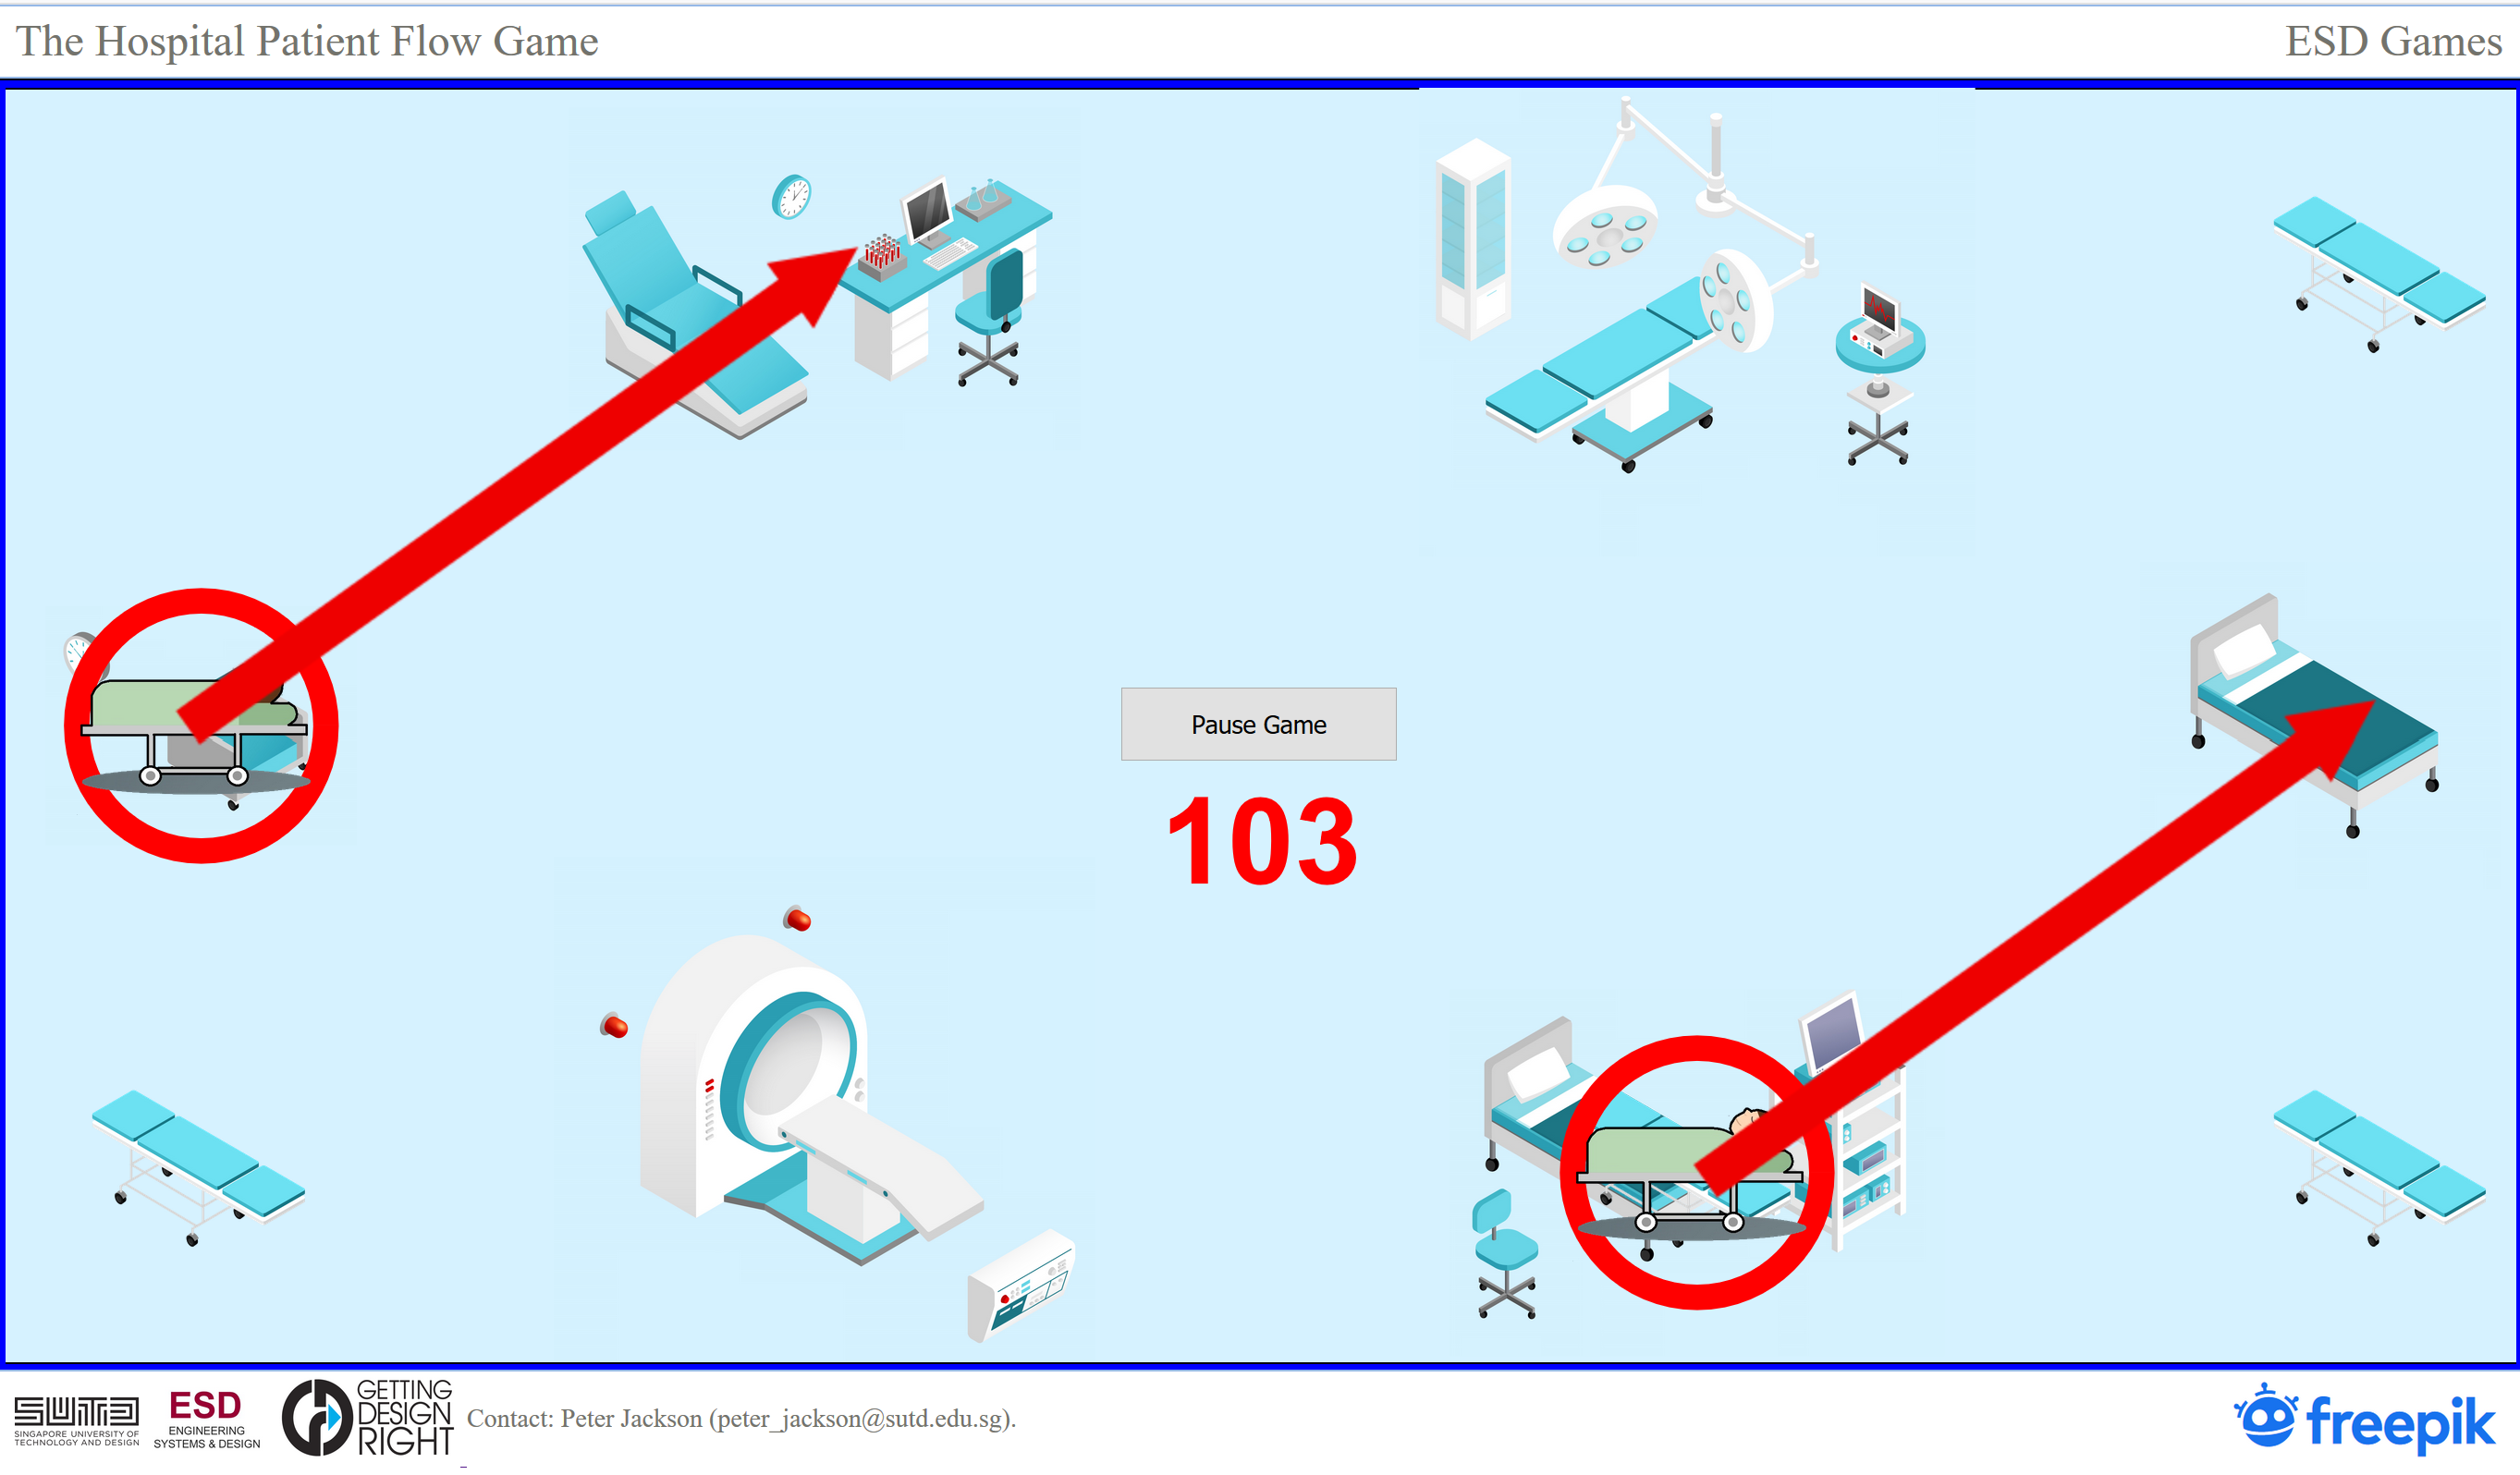
We transport the first patient to the Post-Operative Recovery Room and we wait for the patient to recover. That happens at about 103 time ticks.
Minimize Flowtime
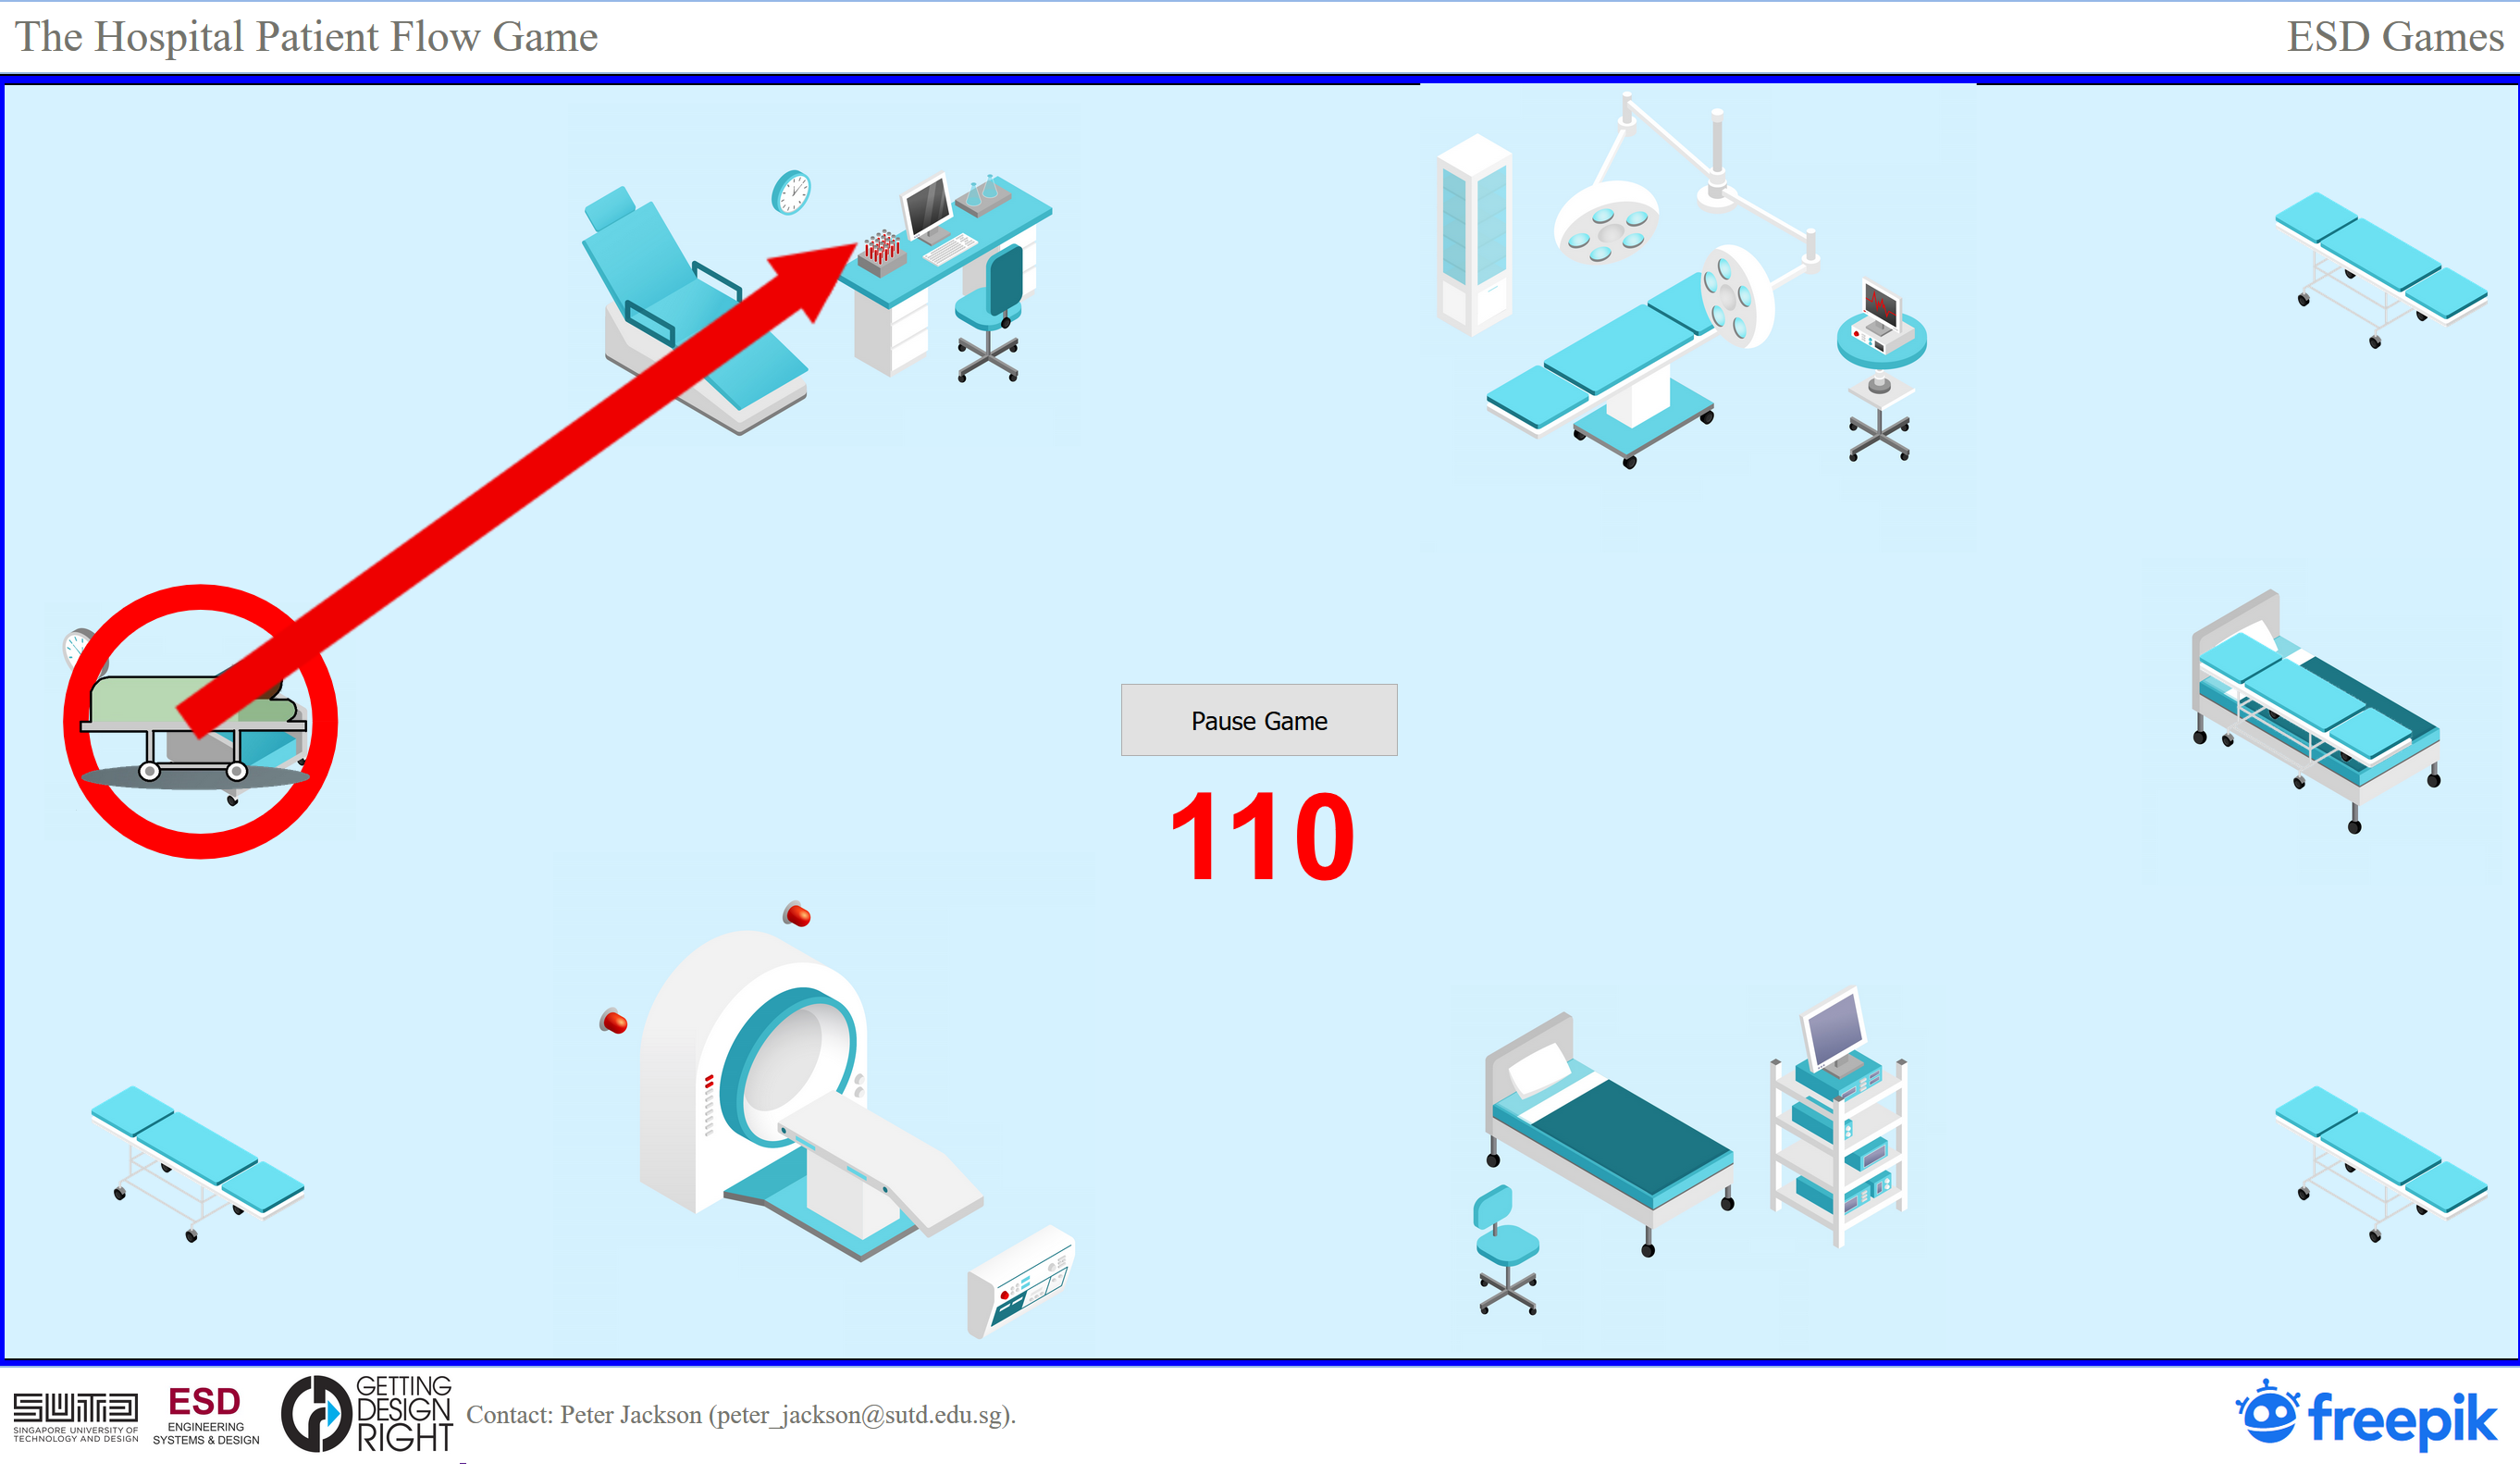
We transport the first patient to the Ward. We don't have to wait here because the patient has left the surgical area of the hospital. The patient disappears from view. That happens at about 110 time ticks.
One patient has been transported through the whole treatment process. From when the patient entered (23 time ticks) to when he left (110 time ticks), his flowtime in the system is 87 (=110-23) time ticks.
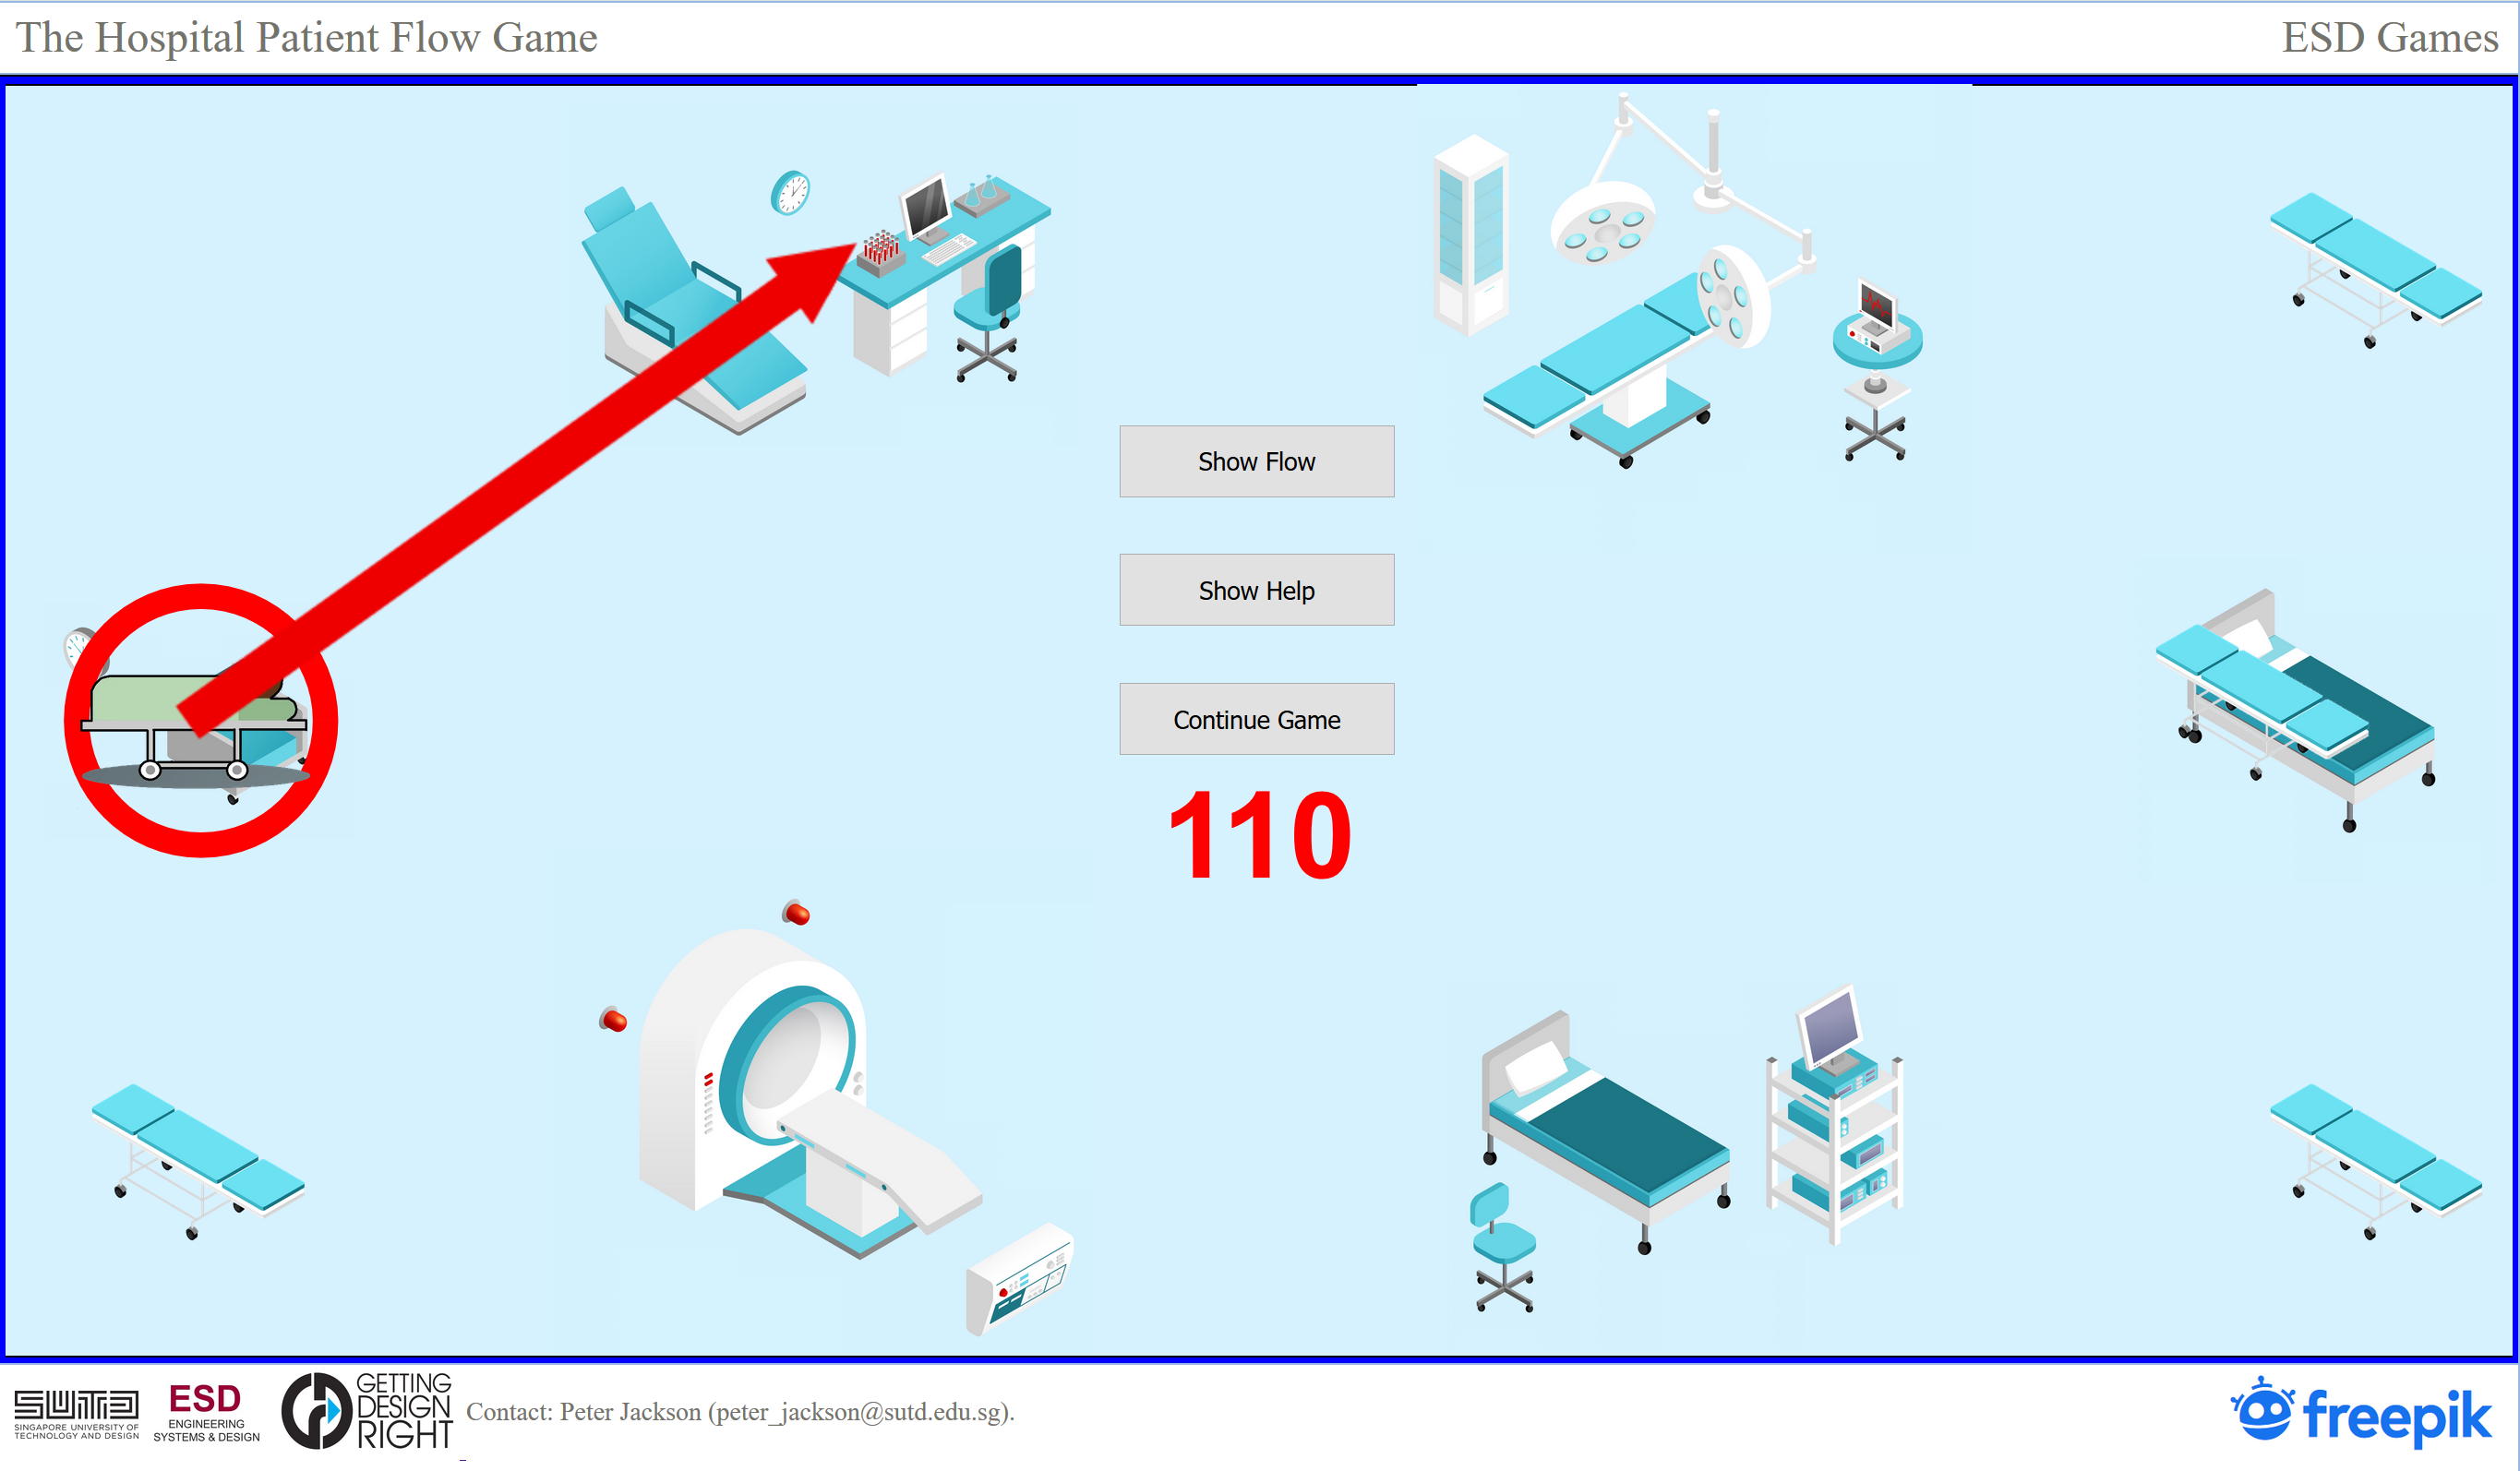
Minimize Flowtime
We pause the game at this point. Two buttons appear: "Show Help" and "Show Flow". We click the "Show Flow" button to get a visualization of our progress.
Minimize Flowtime
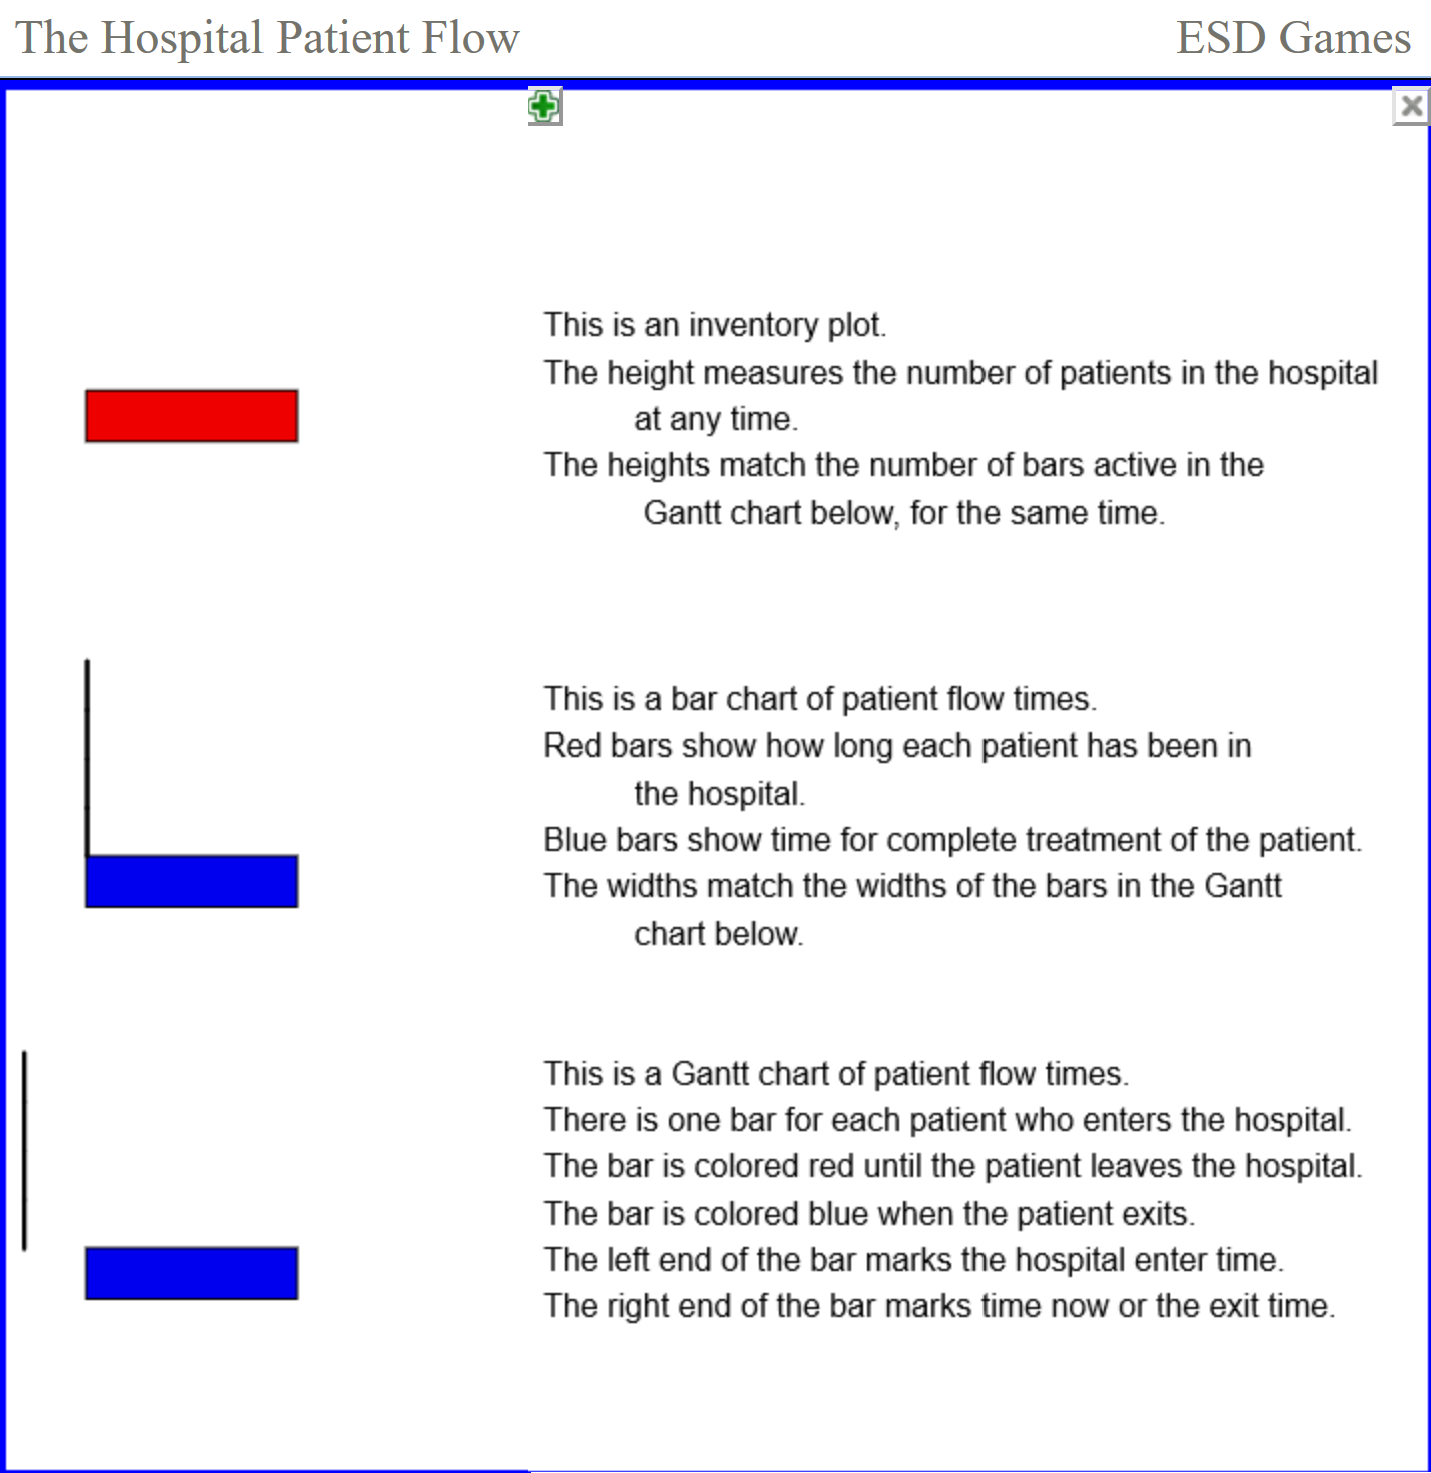
There is not much flow to show yet. For charts at the top and the bottom, the horizontal axis measures time elapsed from when the first patient left the waiting room. The middle chart horizontal axis measures the flowtime of particular patients.
Only one patient has been completely treated so the bars in each chart are identical. There are no axis units showing but we calculated that the bars should be about 87 time ticks long.
Minimize Flowtime
To close the Flow View, we click the "X" button in the upper right corner. This takes us back to the game.
Minimize Flowtime
We repeat the process for the other four patients, one at a time, finishing all five patients at 462 time ticks.
Navigate right to the next topic to explore the flow visualization for this strategy.
Visualizing Our Flow Strategy
In the previous topic we stepped through a strategy of minimizing average patient flowtime.
Next, we will click "Show Flow" to get a visualization of our strategy and our performance.
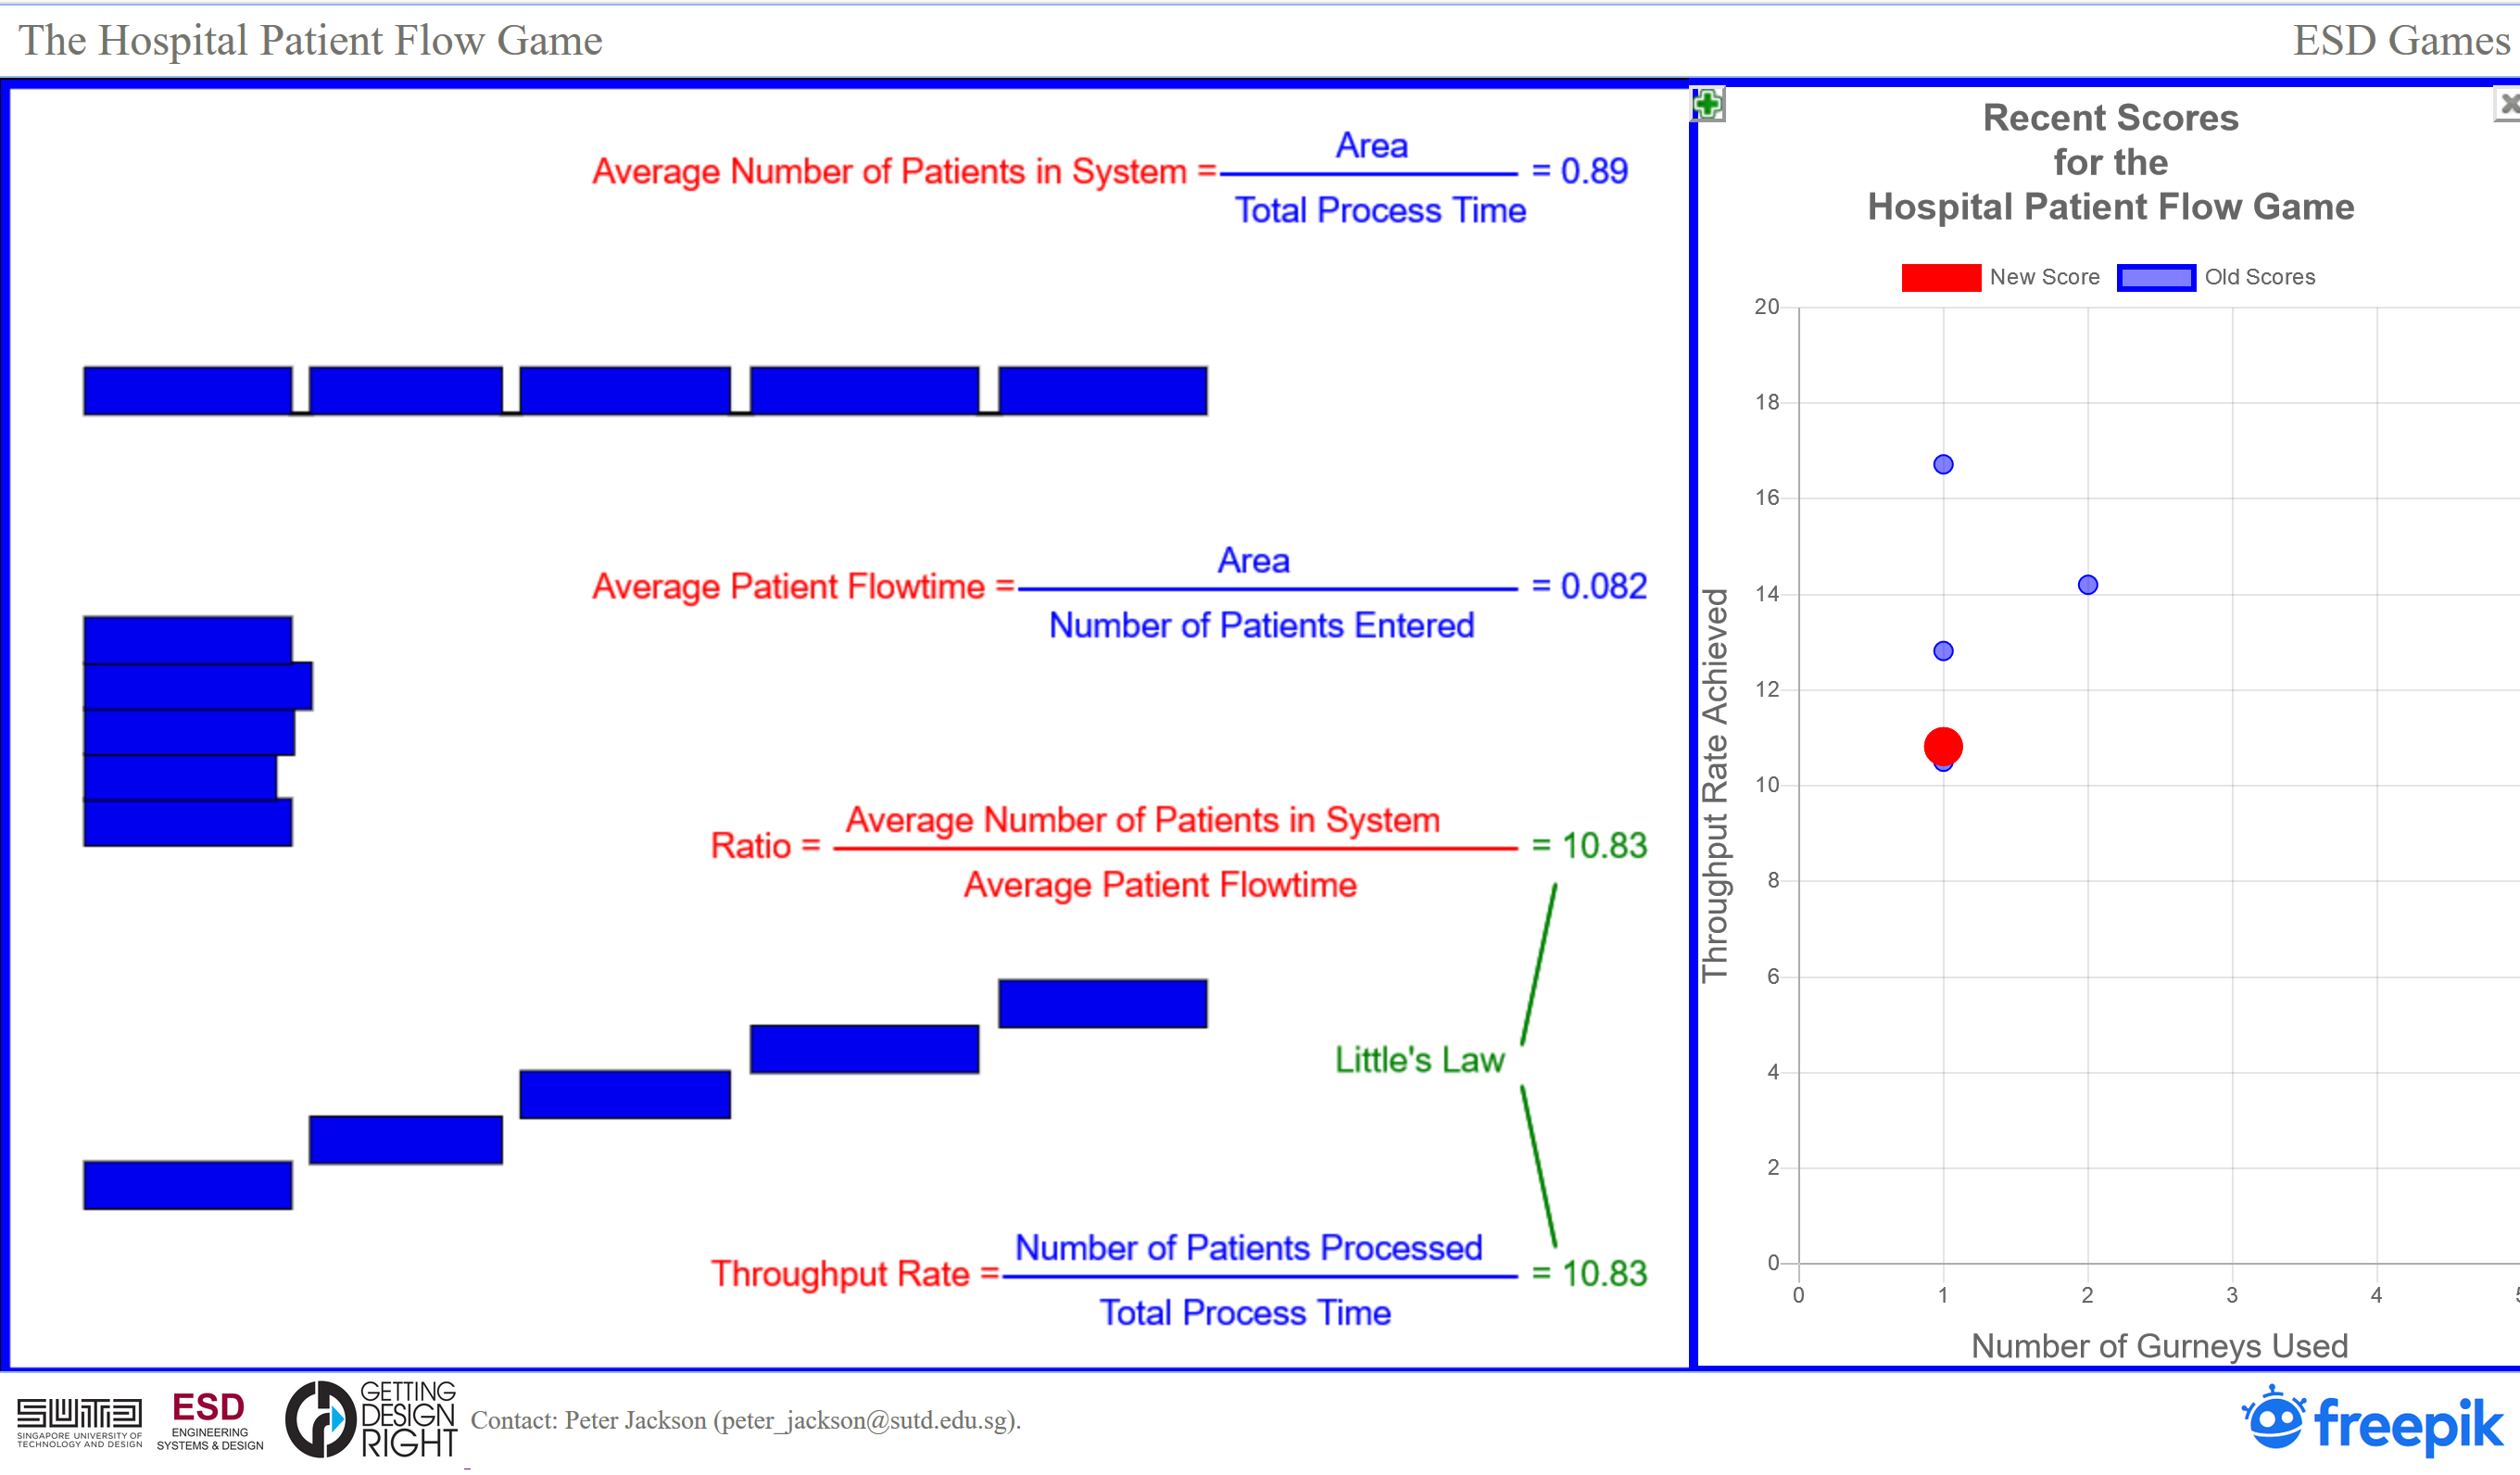
Visualizing Our Flow Strategy
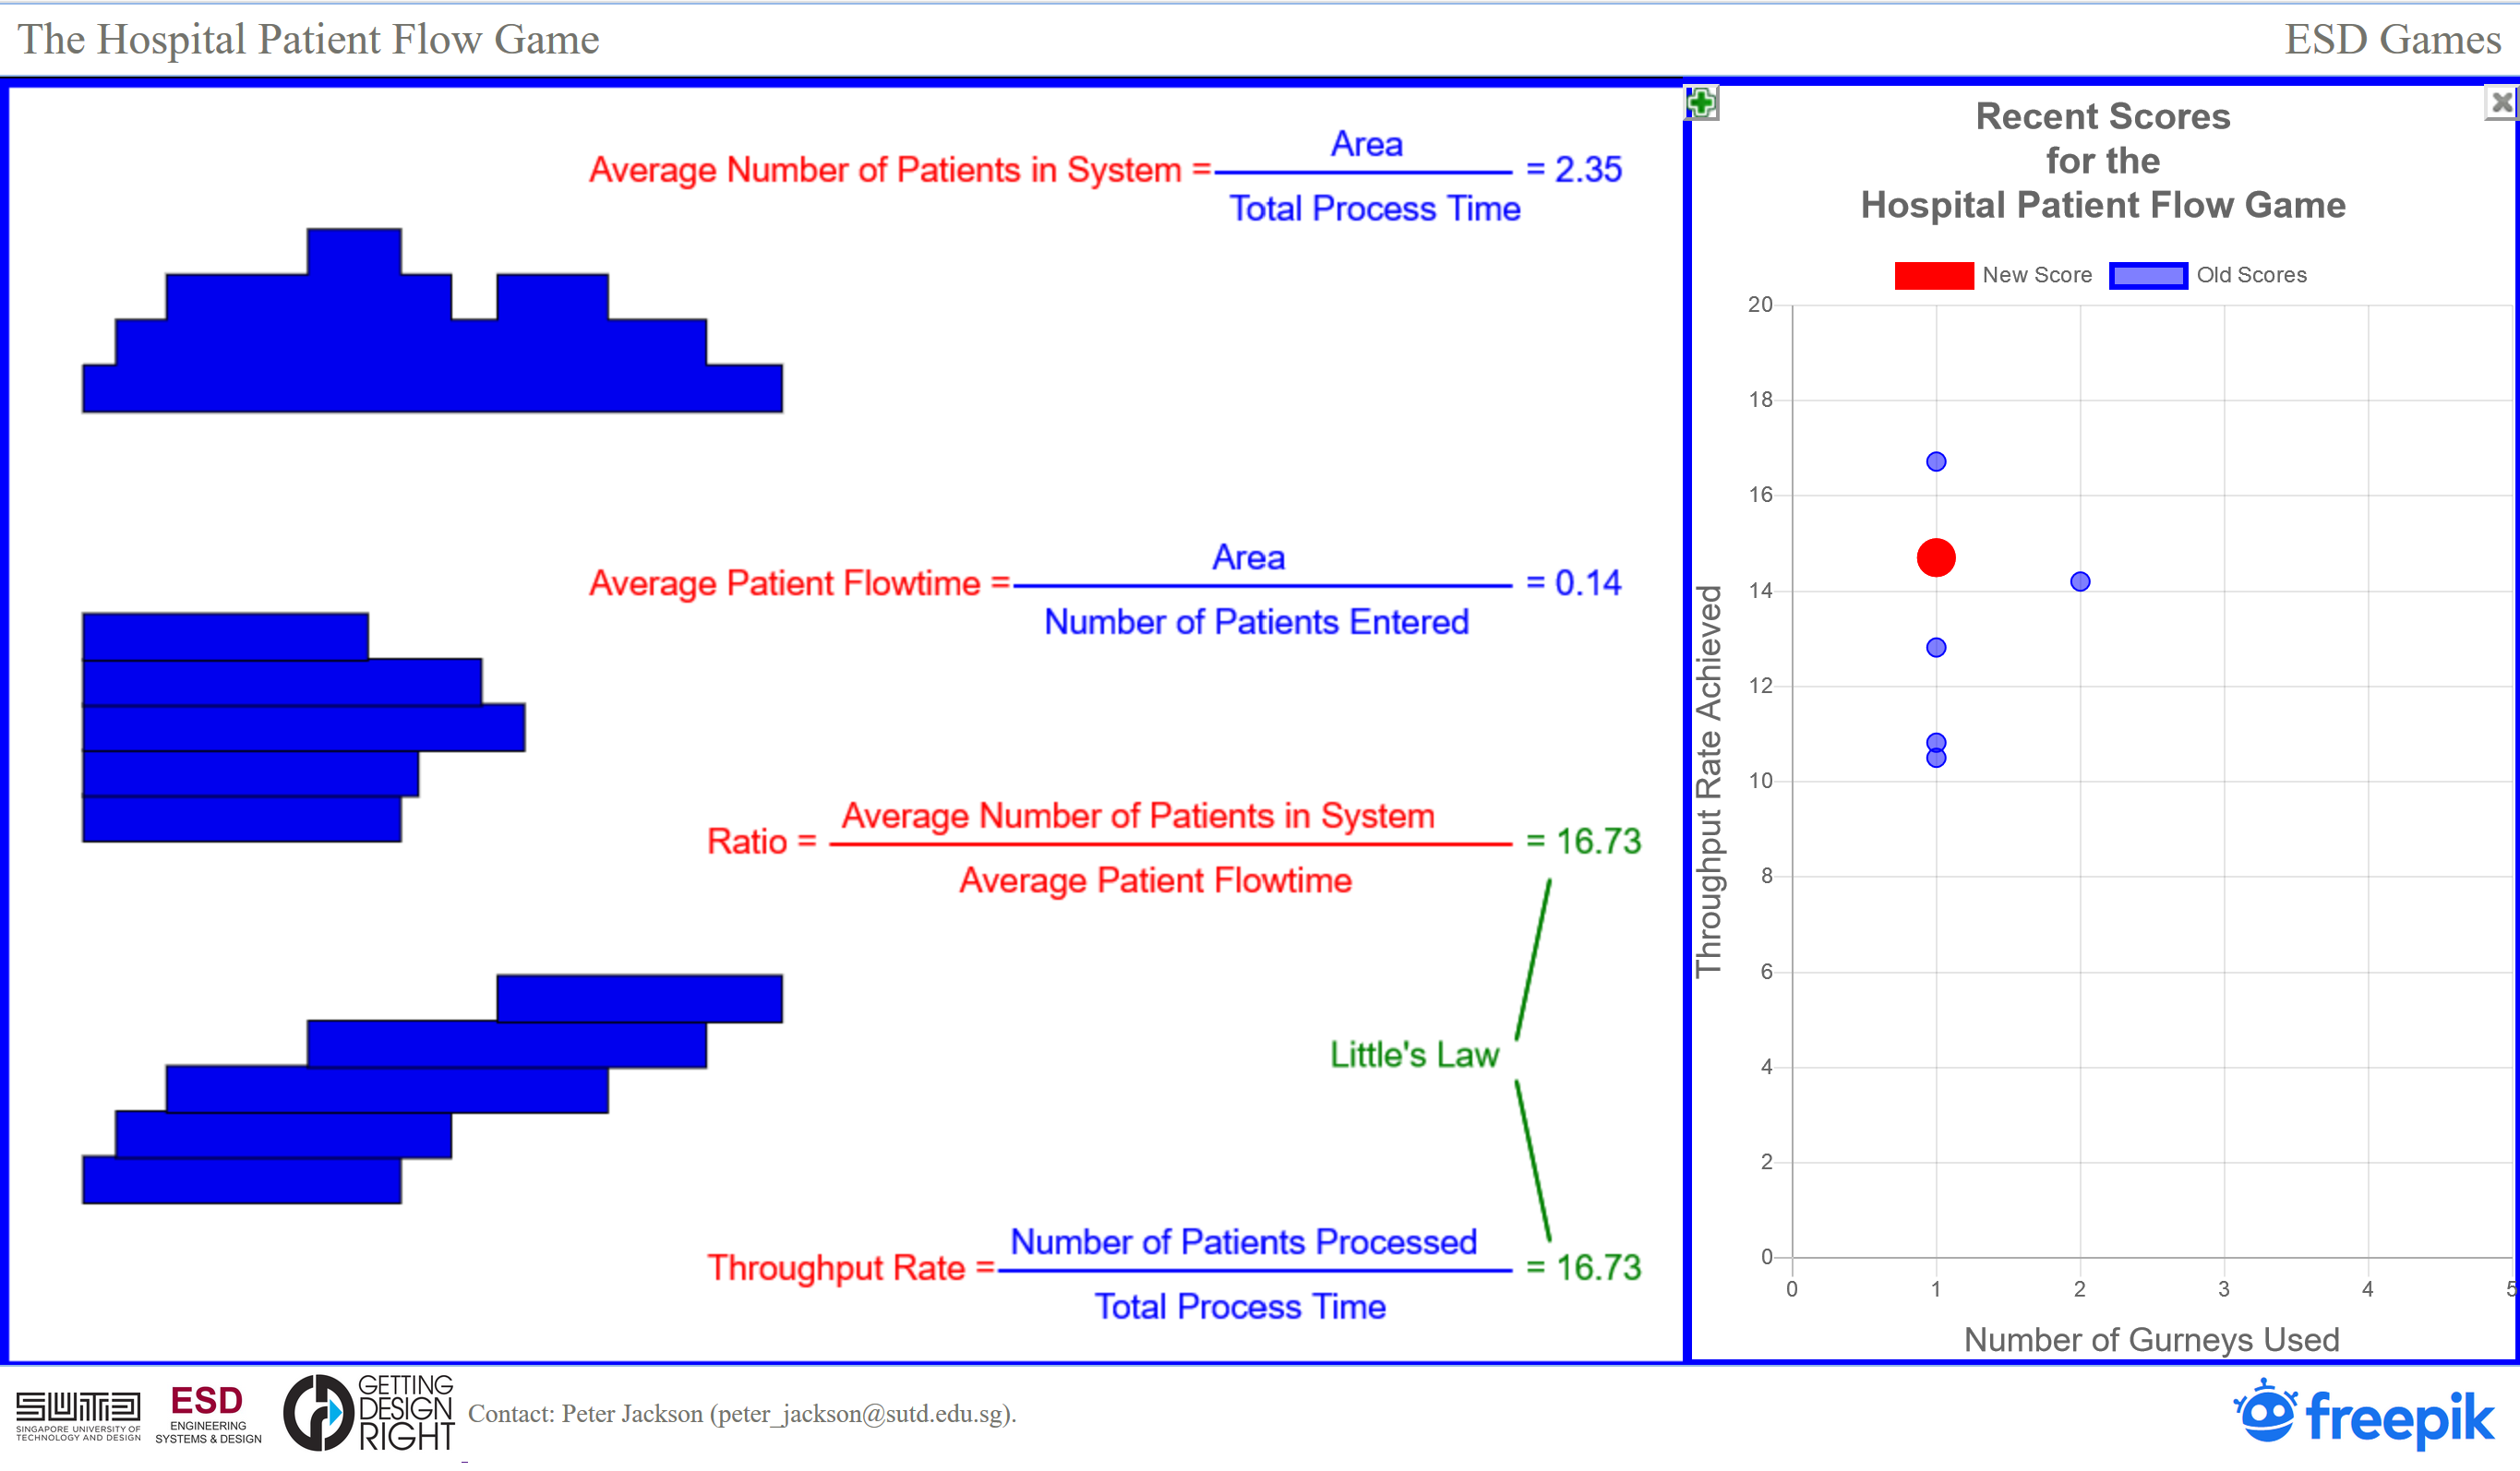
There is a lot in this Flow View now to absorb. Let's focus first on the three charts on the left.
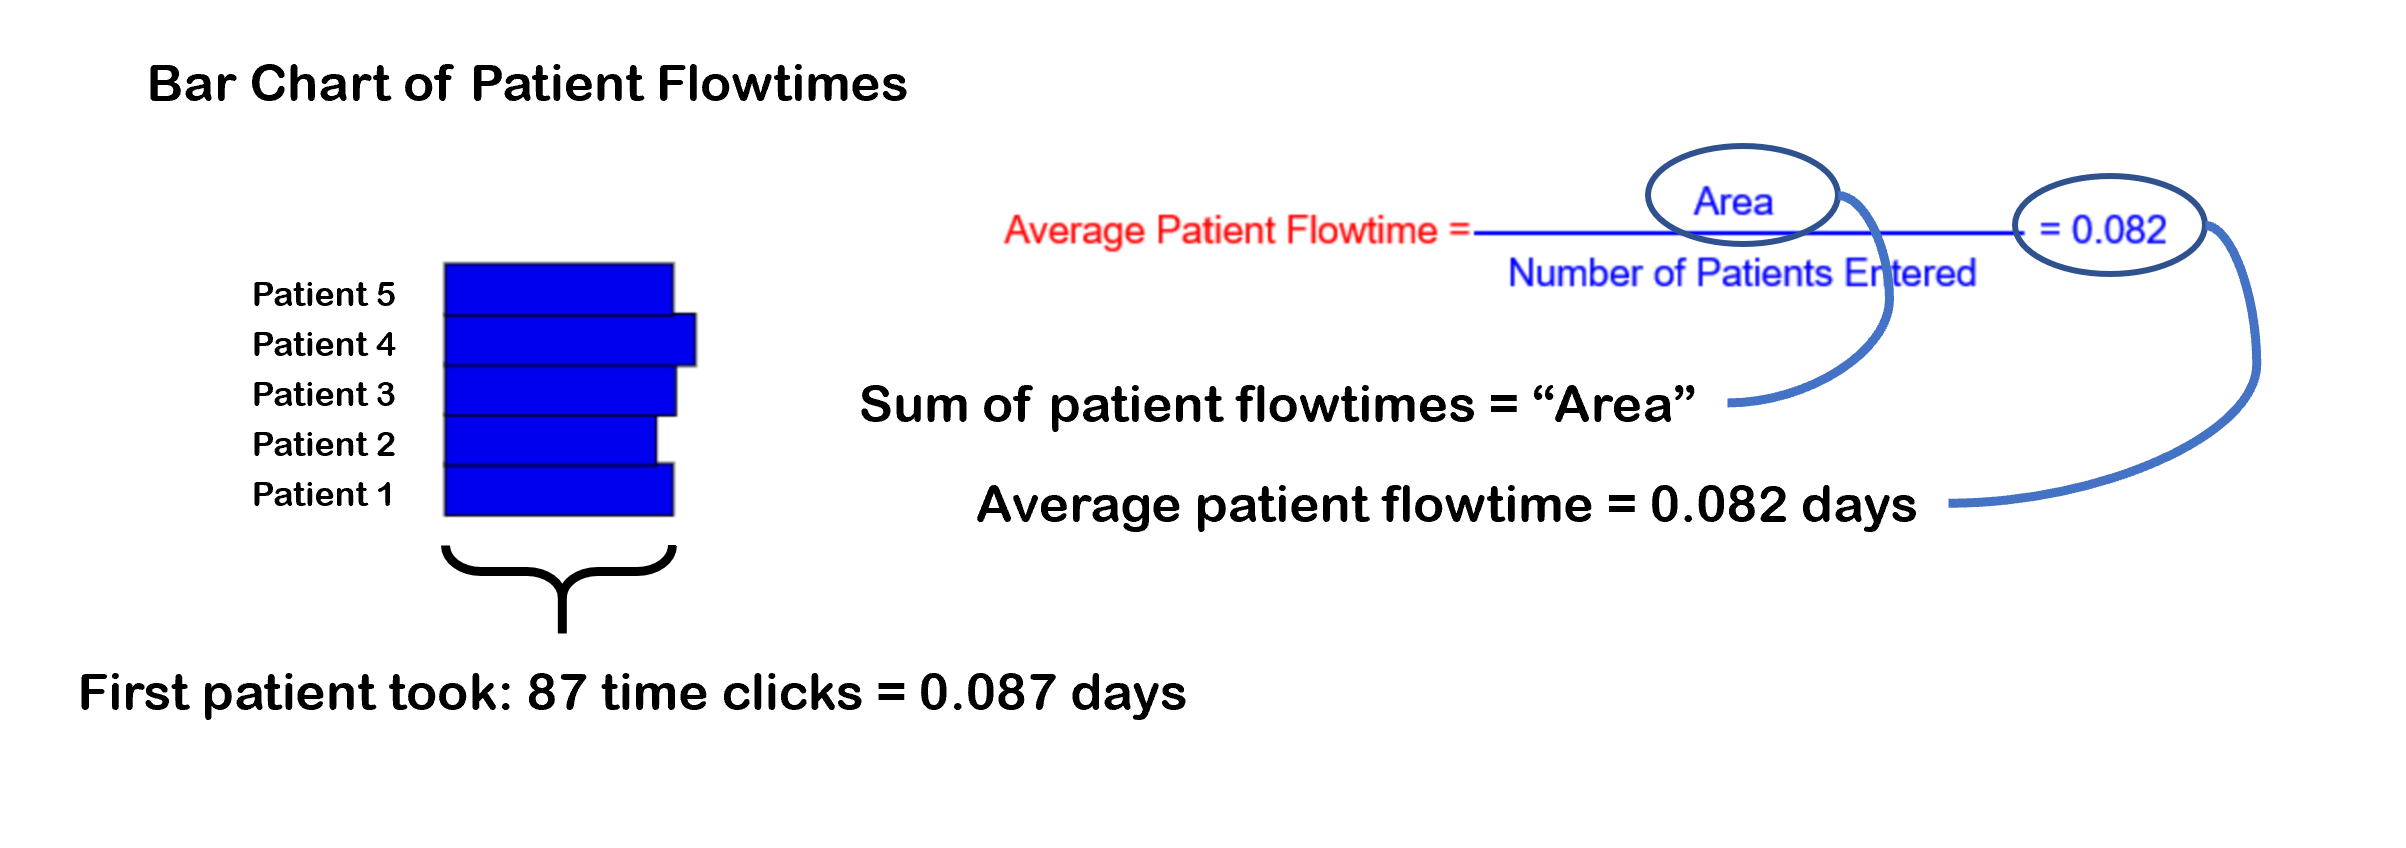
Visualizing Our Flow Strategy
The middle chart is a bar chart of patient flowtimes. Recall we calculated that the first patient had a flowtime of 87 time ticks. That is 0.087 days under our assumption of 1000 time ticks per day.
Over all five patients we averaged a flowtime of 0.082 days and we were reasonably consistent. With better hand-eye coordination we could improve that score by a little but not by much.
Visualizing Our Flow Strategy
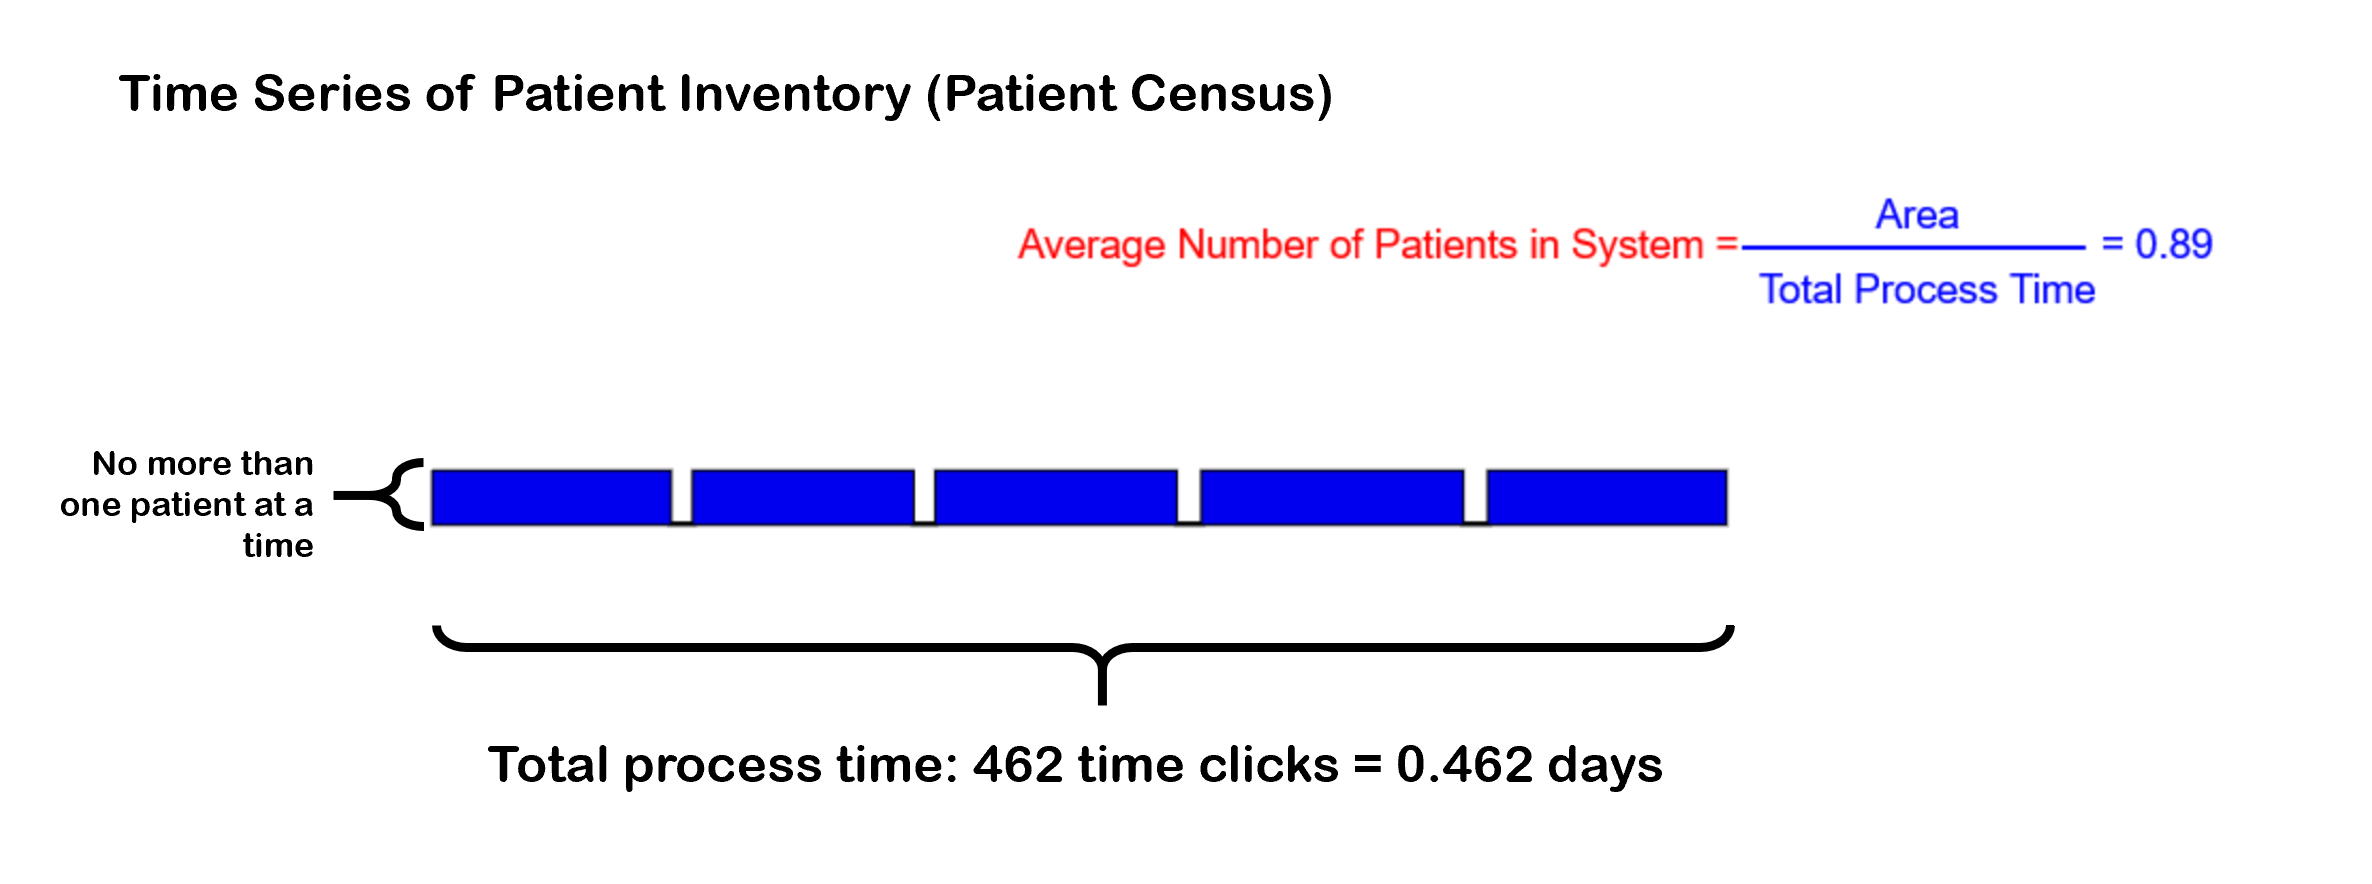
The top chart is a time series of patient inventory (or "patient census"), the number of patients in the system at any time. Our one-at-a-time strategy meant that there was never more than one patient in the system at a time.
There are gaps between patients because it took time to move the gurney from the ward back to the waiting room each time. The average inventory ("census") is therefore a little less than 1 patient.
Visualizing Our Flow Strategy
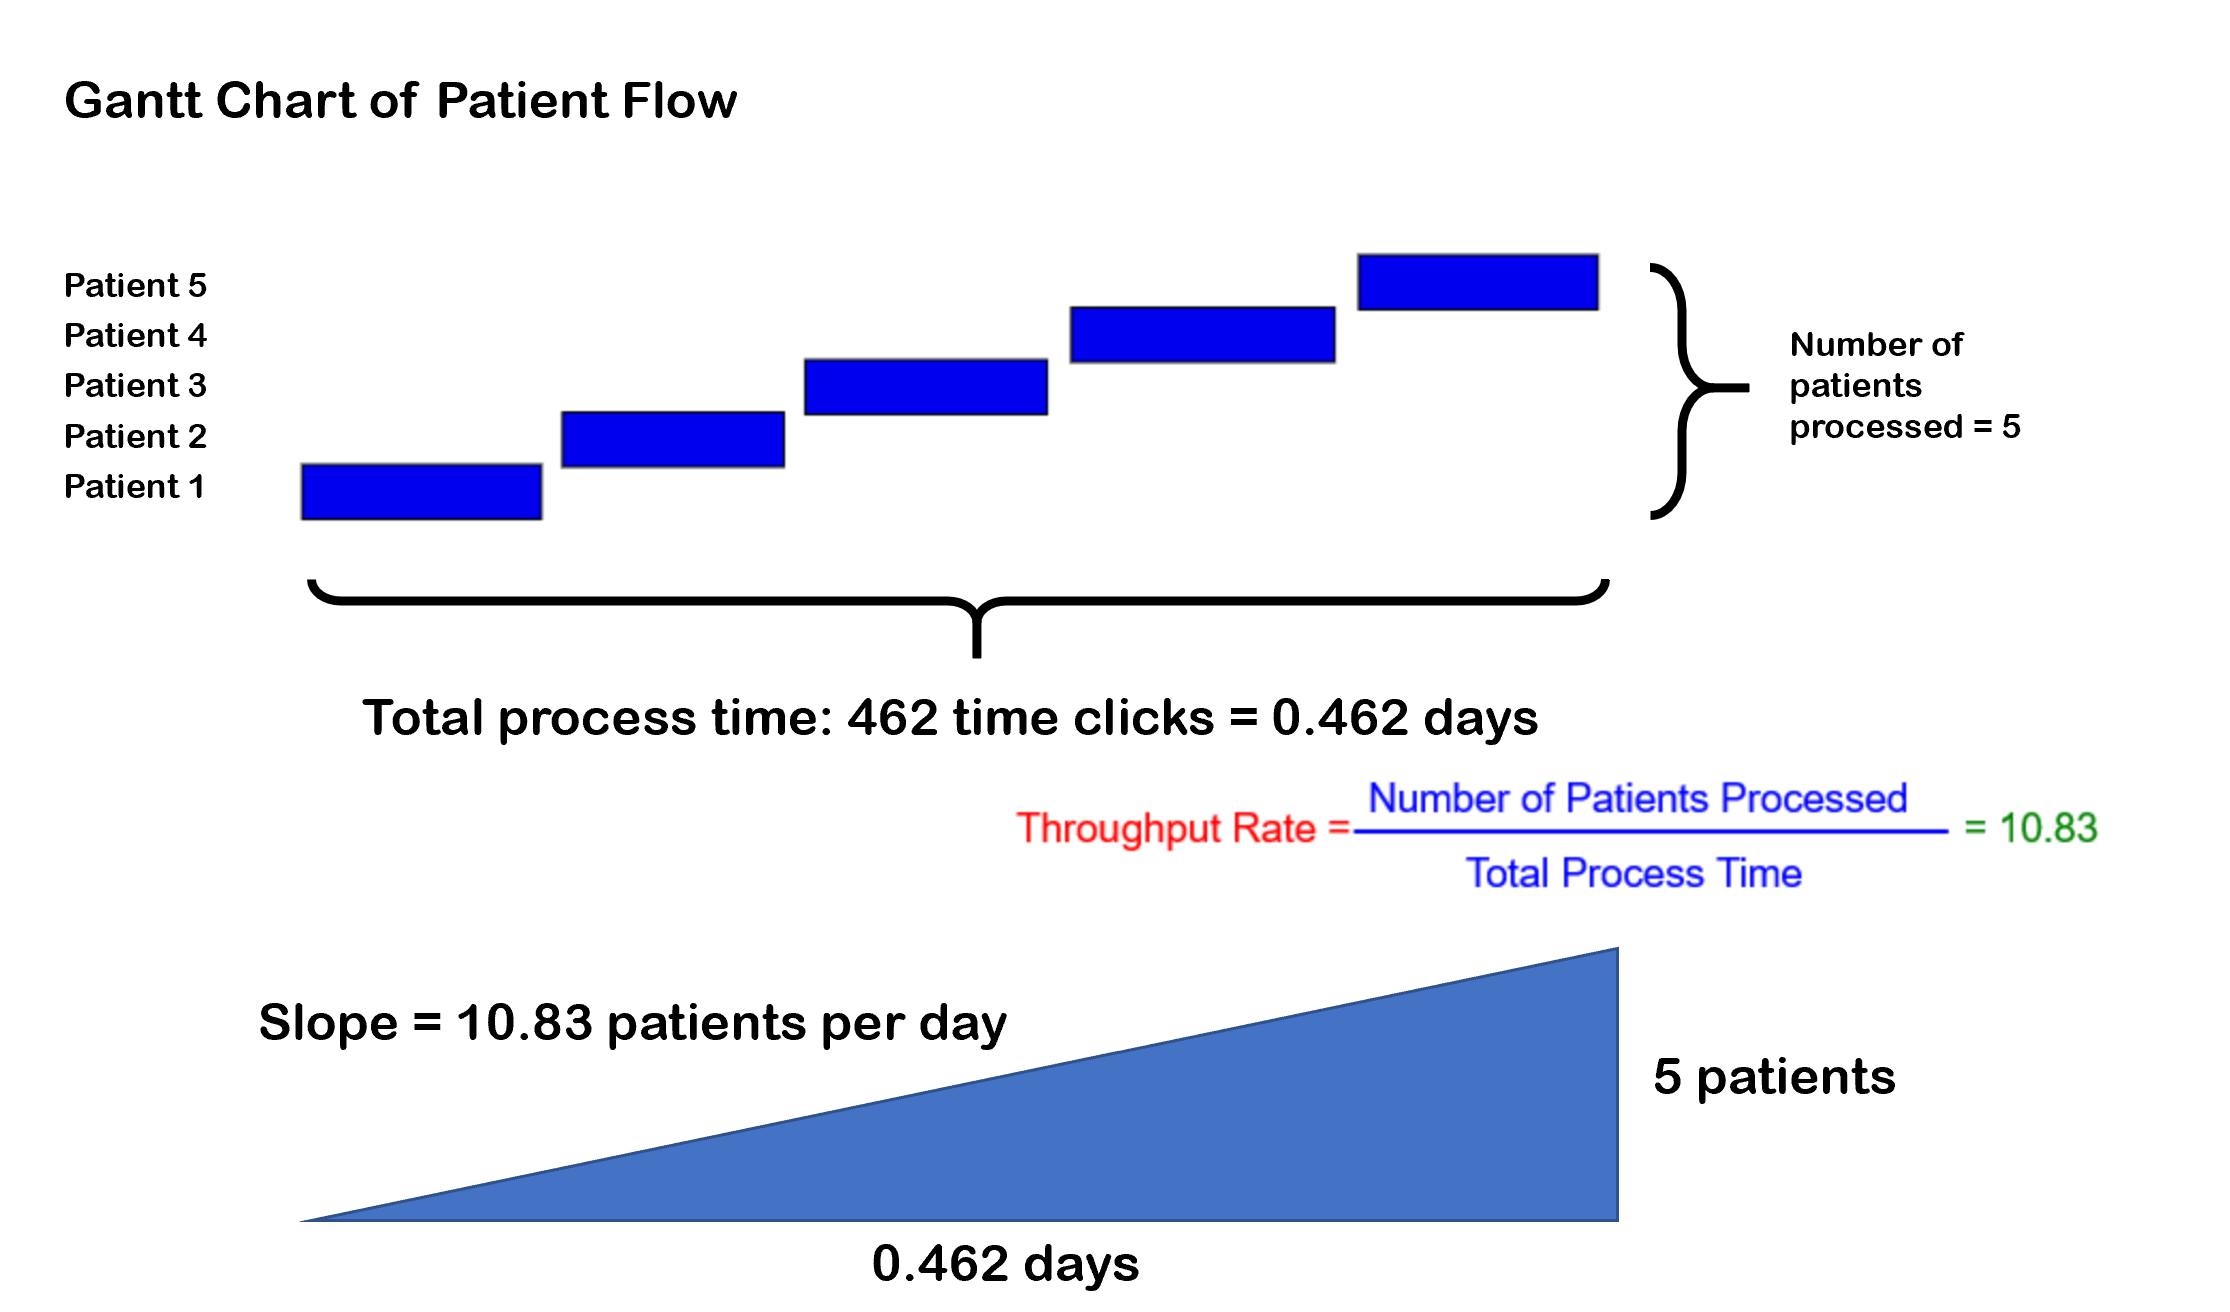
The bottom chart is a Gantt chart showing when each patient entered and left the system.
We can visualize the throughput of the system as the slope of the line running from when the first patient entered the system to when the last patient exited.
Understanding Little's Law
The essential insight to understanding Little's Law is to recognize the colored area in each of the three charts on the left is the same. Convince yourself of that before proceeding.
Understanding Little's Law
A little bit of algebra reveals the relationship.| $$AverageNumberOfPatients = \frac{Area}{TotalProcessTime}$$ |
| $$AverageFlowTime = \frac{Area}{TotalPatientsProcessed}$$ |
| Eliminate $Area$ from these two equations to get: |
| $$\frac{AverageNumberOfPatients}{AverageFlowTime} = \frac{TotalPatientsProcessed}{TotalProcessTime}$$ |
| $$\frac{AverageNumberOfPatients}{AverageFlowTime} = AverageThroughputRate$$ |
Understanding Little's Law
Repeating the formula from the previous slide:| $$\frac{AverageNumberOfPatients}{AverageFlowTime} = AverageThroughputRate$$ |
| Rearrange terms to get the classical representation: |
| $$AverageNumberOfPatients = AverageThroughputRate * AverageFlowTime$$ |
| Or, in the traditional notation: |
| $$L = \lambda W$$ |
Maximizing Throughput
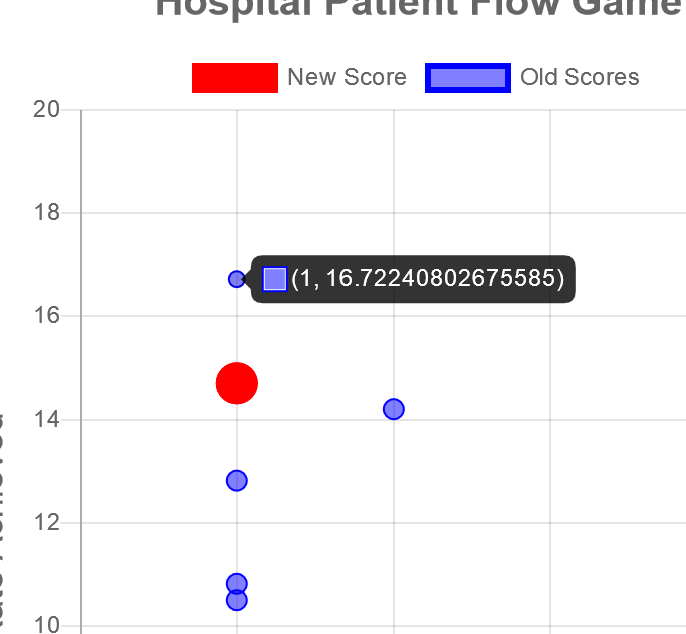
Now we turn our attention to the goal of maximizing throughput. Our throughput score (10.83 patients per day) is shown as a big red dot in the chart on the right.
The blue dots in the chart come from others who have played the game online. You can see that it is possible to get much higher throughput.
Maximizing Throughput
The highest throughput in this sample is 16.72 patients per day.
You can click any of these dots to get the flow views associated with these scores, including your score, the red dot.
Maximizing Throughput
We click on the blue dot for the highest score to see the associated flows.
Note that a natural consequence of higher throughput is higher inventory levels (patient census).
Application
One take-away message from this exercise is that if you want to simultaneously increase throughput and reduce inventories, you must focus on improving flowtimes. That means digging into the process itself and identifying where speed-up can occur. You must reduce setup times, transport times, process times, and so on.
A second message might be that throughput is lost minute by minute. How you make every time tick count is how you win at this game.
And lastly, we hope you never make the mistake of the plant manager in the cartoon.
|
I get it now. Little's Law.
| ||
|
|
Welcome to the "in-crowd".
| |
|
|
|
|
|
Thanks for the game! This was useful.
| ||
|
|
You're welcome. There is lots more where that came from.
| |
|
|
|
|
Learn More
- We hope you enjoyed this module and would like to learn more about applications of probability and optimisation.
- Please visit our website at SUTD Engineering Systems and Design